
Trending Now

$700/Month Portfolio Review & Q4 Earnings Update (2/4/2026)
01:32:44
The $500 Billion AI Bill Comes Due
06:02

The Race for AI Supremacy
07:20

The Great Recalibration
07:27

The Day the Narrative Flipped
07:08

Moltbook vs Round Table Consulting: The Tale of Two AIs
06:50

FOMC Statement, Powell and our Top Trade Review! (1/28/2026)
01:51:23

Market Manipulation Playbook
07:00
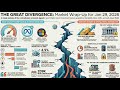
Market The Great Divergence: S&P 7000 Stocks Versus $5,500 Gold
05:45

Trump's Kids Savings Plan Exposed
07:28