SP Weekly Chart Updated and Some General Thoughts on Markets
Courtesy of Jesse’s Café Américain
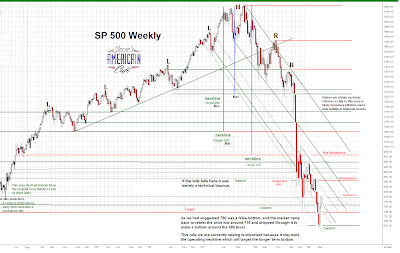
Today we will take a look at the longer term SP 500 weekly price chart, updating the weekly chart which we last published in March 2009.
The rally, although sharp, is well within the bounds of expectations for a rally from a major market bottom off a steep decline.
The target we set for the rally to the neckline around 960 ‘worked’ which tends to validate it, for now, as a proper neckline.
If in fact this necklne holds, and the SP breaks down through key support, the chart formation sets up an objective of 360 on the weekly SP cash chart.
Here is the SP weekly chart update: [Click on charts to enlarge.]
Keep in mind that the chart formation is long term, not immediate, and it must be validated further by a breakdown through key support. If, for example, the Federal Reserve decided to monetize even more aggressively than it has been doing, then it would be likely that the neckline would be broken to the upside, and we have a target showing where we think that will go.
Think of these charts as a ‘map’ to help us see where we have been, the most likely path, and the terrain, the lay of the land. Charts are not firmly predictive, only probabilistic. Those who make contrary claims for their system have always been shown to be exaggerated and highly selective in their result recording and reporting.
Many traders merely exploit weaknesses and minor informational or systemic advantages or inefficiencies in the market and in essence place a ‘tax’ on the other market participants, usually the naive and inexperienced.
Sorry, but that is the way that it is. This even includes some of the ‘too big to fail’ boys who have no business exploiting the markets which need to function as efficient capital allocation mechanisms.
There is a tendency to seek to gain unfair advantage. The notion of a good and rational market that can regulate itself and voluntarily obey the rules should be an obvious howler to anyone who has recently driven on a freeway and see how people act in the real world. Its a fallen world, and regulation and enforcement are a sine qua non, and always in need of refreshment and improvement like all things temporal.
Here is the original March chart.
Some traders are better than others, and some much better. The vast majority of people are in no position to trade, and have no temperament for it, and should leave it alone. They are investors, and enjoy a diversity of lifestyle. Trading is a profession, and needs to be respected as such.
The average person who is even in decent physical condition would hardly think to step into the boxing ring with the world heavyweight champion. And yet this same person thinks nothing of placing leveraged wagers in markets dominated by professionals who do little else for a living, heavily influenceor even own the rules boards and help to pick the referees and pay their salaries.
So, what next?
The outlook is rather gloomy for the SP 500 in real terms, decidedly. There is no recovery in the real economy, merely fakes and the push and pull of ‘flation. The Federal Reserve and the Obama Economic team are not even beginning to address the issues that will create a sustainable recovery, and are just doing the same thing that has failed before. The recovery from the 2003 market lows was nothing more than a monetary credit bubble, glossed up with statistical and accounting frauds. This is just more of the same, to a more extreme, even more cyncially corrupt, degree.
So what next?
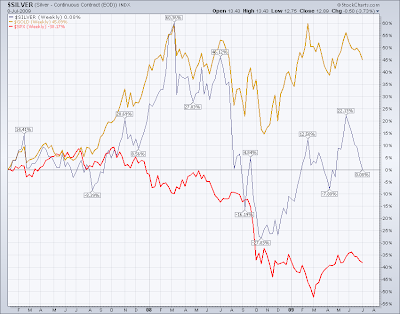
Gold still looks like a winning place as a store of value in times of corruption, decline and deception, although nothing is certain.
Yes, if you were able to time the market and buy the bottom in stocks, and pick the right ones, and hold on until the top, you have remarkable gains. You are also gambling, and good luck to you.


