 In early November 1999, the Dow was at 10,500.
10 Years later, it's a different Dow that sits at 10,000 than we had back them with AlliedSignal, Citigroup, Eastman Kodak, GM, International Paper, Minnesota Mining, Philip Morris and SBC Communications now replaced by Cisco, Chevron, Hewlett Packard, Kraft, 3M, Pfizer, Travelers (who became Citigroup in 1999, ironically), Verizon and Exxon. The Dow finished 1999 1,000 points higher, at almost exactly 11,500 despite the fact that many people thought computer clocks would fail to roll over and wipe out Western Civilization on January 1st.
Not even 60 days later, the Dow was down 2,000 points in what used to be the second worst market collapse in history. It took us all the way until September of 2003 (33 months) for the Dow to really bottom out at 7,500, where we consolidated until early March and then flew up all the way back to 10,500 again to close the year. We flatlined between 10,000 and 11,000 until the Summer of 2006, when the market went into overdrive, led by financials and commodities all the way to Dow 14,000 in October of 2007, where we bottomed out this March (18 months), once again at 7,500 (discounting the crazy, panic-spike down in March) and, once again, we are back at 10,000 in November.
 One of the key reasons that "this time it's different" is that inflation has now become a friend of the markets. Just look at the Dow – Oil is a COST to most companies, high oil prices benefit only oil producers yet we've replaced an Auto Manufacturer (GM) who was wiped out in part due to the high price of fuel, with CVX, who makes that fuel. GM lost hundreds of thousands of productive American jobs in their collapse – were those people hired by Chevron? Hardly – it takes the same 67,000 people at Chevron to charge you $3 a gallon for gas as it does when gas is at $1.50, it's all a question of profits for the oil companies and, sadly, 75% of that excess money gets shipped overseas and does nothing to benefit the US economy.
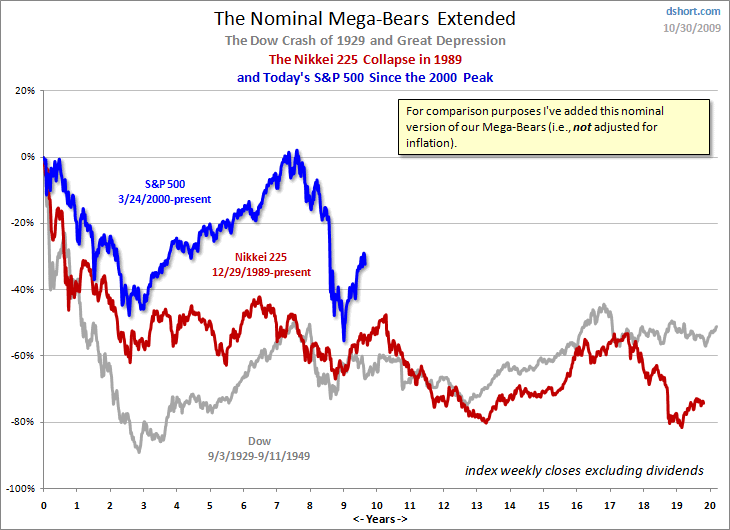
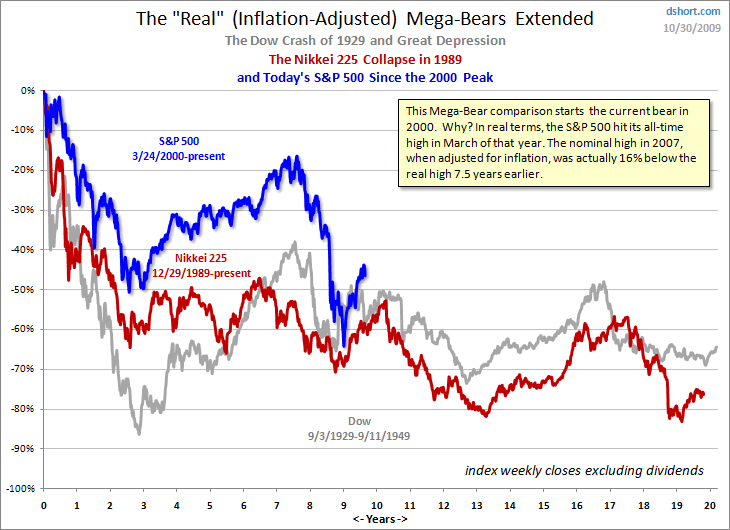
If we were to adjust the S&P for inflation in the above chart, you can see that our recent run-up looks a little less impressive in the grand scheme of things. Like the Dow, the S&P has altered considerably in the last 20 years but think about the disproportionate weighting now given to commodity stocks, which make up 16% of the S&P and Financials, which are 12%. Health Care (14%), as we know is another drain on the remaining 58% of the S&P 500 sectors, which are: Technology (18%), Consumer Staples (12.5%), Industrials (10%), Consumer Discretionary (9%), Utilities (4%), and Telcom (4%).
Warning – Red paragraph for communist emphasis: Notice Utilities are 4% of the S&P even though they have gone up considerably with inflation over the years. Why? Because the government regulates their profits as it's wrong to allow a necessity to bleed the people dry. Regulating utility profits forces investors to seek returns in other sectors that are generally more beneficial to the average citizen's lifestyle when they do well. Why then, do we not regulate commodities and health care the same way – turning them into solid, dividend-paying investments? That would direct investment dollars seeking high returns back into the sectors that innovate and produce things that actually IMPROVE the quality of people's lives and create (gasp) jobs!
 Notice the similarities of Health Care, Financials and Energy/Materials sectors: You can't live without them, they move with inflation and they pay incredibly disproportionate wages to top management. If you are one of millions of low-paid hospital workers or health care assistants, you are not very excited about UNH taking in $22Bn last quarter (the second most ever), nor are you going to be sipping Dom Perignon with your share of their $1Bn quarterly profit. If, however, you are CEO Steve Hemsley, who just exercised $6.23M of options on top of his $3.12M salary – then you are probably doing cartwheels off your yacht.
I'm not picking on UNH, which is a company we were actively buying when they were on sale in the spring, but where do you think the extra $13Bn of revenues they are taking in this year (over 2007) are coming from? That's right – if you happen to work in one of those other, unloved sectors, then that money was taken away from you and your customers as it was driven towards the sectors they need in order to live. Has a 20% increase in Health Care costs allowed us to live 20% longer than we did in 2007? Does the 100% increase in the price of oil since March of this year allow us to drive 100% farther or does it increase the productivity of our fuel-burning manufacturing (what little is left) by 100%? Natural gas is up 150% since March, Copper is up 200% – is any of this helping you or improving your lifestyle?
 What then, is the market measuring? When the health of the stock market becomes a misery index for the bulk of society then something is very, very wrong and this week's action – a strong rally based on squeezing 10% move labor out of the workers while paying them 15% less than last year, is not something to be celebrated but to be feared – because it is the calm before the storm.
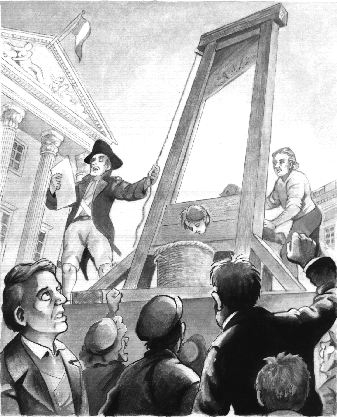
The Russian Revolution began on Thursday, Feb 23rd, 1917 when people on a food line started a demonstration when the bread ran out. As they marched through Moscow they were joined by striking factory workers who wanted a share of the profits being made by the owners and they were joined by other factory workers as the word of the strike spread. It was a spontaneous million-man march on the capital in by Feb 25th (Saturday), the city was shut down and by Monday the cabinet had resigned and, on March 13th, Czar Nicholas was deposed. Funny how these things sort of "sneak up on you."
 If we are not going to have a revolution, or at least some sort of snap-back in what has become an abusive system that is creating greater and greater inequities every day, then I propose we follow this investing premise to it's logical conclusion and start buying stakes in water and oxygen. Like health, energy and food, water and oxygen are two more things people just can't seem to live without and, up until now they have been treated as natural resources that are generally regulated by the state. Sure people will pay for water but the problem is they don't NEED to and air is just being given away by trees.
So our primary goal will be to secure ourselves large amounts of air and water while there seems to be little need for it. This should be easy enough to do as we can follow the business plans of the industrialists who bought out the individual farmers during the 20th century and turned food into big business or the business plan of the oil barons, who leased every available drop of oil in this country and then dropped production year after year (while everywhere else in the world production increased).
Once we have our rights locked down the next step is to eliminate the competition. This can be done simply by contributing to anything that pollutes the air destroys the water supply, the same way oil companies pushed to destroy public transportation and backed interstate highway bills and sold America on building an auto-driven, fuel burning economy. Fortunately, there is great profit in doing either of those things and very little penalty so we can have a field day there until we achieve our goal of rendering the water undrinkable and the air unbreathable. THEN we pounce and start selling our water and air at ever-increasing prices until it consumes close to 1/3 of the average worker's entire effort just to be able to afford to breathe and drink. We don't have to worry about the wealthy opposing us as $15,000 worth of air and water per family won't bother them (and, of course, we'll make sure they invest right along with us) while we rake in $15,000 x 100M US families or $1.5Tn a year – all for something that is currently free!
Let's call it a 40-year plan because that's about how long it took food to go from 5% to 15% of a family's income and for energy and transportation to go from 4% to 18% of income (here is a great comparative chart for how we in America spend money compared to the rest of the world). Health care is a model we should follow for taking over the water and oxygen game because, as recently as 2005, health care costs consumed just 3% of a family's average income ($46,408) and now, in JUST 4 YEARS, it's up to 6% – THAT's the kind of growth we'll be looking for if they want to keep breathing! Of course median income has dropped to $43,506 (6.25%) over that same time period but that's OK, they can always cut somewhere else, right?
Housing is actually the most incredible thing. In 1945 the inflation adjusted price of the median US home was $70,000, that was lower than the typical $90,000 of the last 100 years and soldiers coming back from war coupled with government assistance programs raised housing prices up to as much as $120,000 in the 70s and 80s housing bubbles but generally $105,000 was a fair price, roughly 2.2 year's of the average family's income. Although home prices are now off their peak of $200,000 (5 times income) in 2006, they are still hovering around $160,000 or 4 times what the average family earns in a year.

 Of course, Shiller's data doesn't take into account how much of a person's DISPOSABLE income goes into a home, nor does it factor in that we had full and growing employment PLUS a Social Security system that actually worked and did pay our grandparents enough money to retire comfortably on since, until 1998, the cost of housing never went over $125K on the chart. You would think it wouldn't be possible to jack housing up 100% in a decade since homes are so expensive but that's where good old American ingenuity came in to play as our banks reduced the down-payments required on a home from 20% to 10% and even 5% while Allen Greenspan dropped the Fed funds rate from 10% in 1989 all the way down to 1% in 2004, which lowered the effective interest on single-family homes from 9.5% in 1990 to 4.5% in 2003-4.
This allowed Americans to go from promising to pay 2.5 times their annual salaries in 1997 to 5 times their annual salaries for the same exact home in 2007. Again, it's one of those fantastic industries where you can just keep charging people more and more money without giving them anything more that you used to make. By repackaging home ownership as in investment vehicle, clever realtors and mortgage brokers were able to convince Americans that diverting all of their potential savings into a mortgage payment made economic sense. This plan was aided and abetted by the media and Wall Street, who clamored to tell you that Social Security would be bankrupt and you could not possibly save enough money to retire on unless you either put it into housing or put it into the stock market, causing a massive bubble in both.
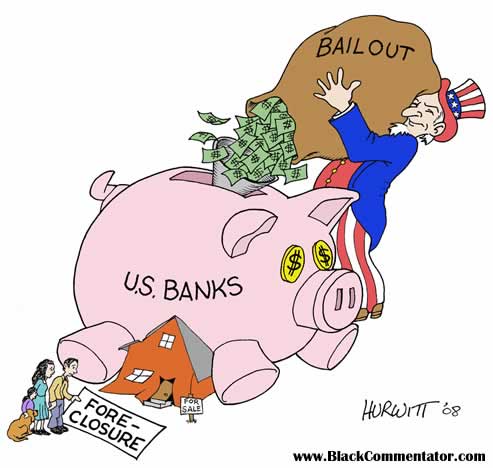
So POP!, here we are, in the midst of our "recovery" but what exactly is it that is getting better? We are losing more jobs, more people and corporations are going bankrupt and more homes are being foreclosed every day while the government bails out the bankers who made the bad loans rather than just giving the money to the people so they can pay the bankers THE SAME MONEY without having their lives destroyed. How does that make sense?
If BAC has lent out $1Tn for homes and those homes have lost 30% of their value and 20% of them are falling into default. Then BAC must write off roughly (assuming 10% down payments) 20% of their homes with a $200Bn loss or $40Bn. We, the people, through our government, have to give them that $40Bn to keep them solvent while $200Bn worth of homes (1.1M) are foreclosed and 1.1M families' lives are destroyed. On the other hand, if we assume the average of those 1.1M families have a $2,000 a month mortgage, then we could just give them $2.2Bn a month to make their payments (assuming they even need 100% of it covered) and they, in turn, give the money to BAC who now have no delinquent mortgages they are forced to write down. Keeping the people in their homes takes pressure off the housing market (40% of all homes sales are foreclosures) and keeping families in the communities helps the local governments balance their tax burdens and provides a consumer base for businesses.
 Giving $40Bn to BAC gave BAC $2Bn worth of profits last quarter but did nothing at all for the 1.1M families they foreclosed on. These are the choices we make as a society and, frankly, the choices we have been making make me sick! Don't forget we are compensating BAC for 100% of their loss on the home ($40,000 on a $200,000 home) but nothing for the family that put down 10% or $20,000 of their life savings, not to mention all the money they paid into the home since they started. A family that bought a $200,000 home in 2004 for $20,000 and carries a 6% mortgage would have paid BAC $64,751.40 over 5 years yet they lose that and their deposit when the mortgage defaults. At 9%, that number jumps up to $86,899.20 paid to the band for the home that gets taken away (plus the $20,000 deposit).
How do we expect these families to recover? Why are we, the people, bailing out the lenders and not THE PEOPLE? I'm making this article freely available today so you can Email it to your friends, families, Congress etc because until we, the people, get together and let our elected representatives know we have had enough, then money will continue to talk on Capitol Hill and we will have no voice of our own as our country is being taken away from us.
Now, on to happier news: Last week I urged extreme caution and we were bearish on the markets and that worked out fantastically into the weekend. I had mentioned 10 of our plays in last weekend's post and our one loser, CAL has bounced back in our favor from down 100% to up 22% and those were naked $13 puts sold with CAL now back to $12.77 as of Friday's close. We came much closer this week to the upside target levels I set in the post, when I said: "All we are asking of the markets is for them to take out our very simple levels and hold them for more than a day or two. Those levels are (and have been since early September): Dow 10,087, S&P 1,096, Nasdaq 2,173, NYSE 7,204 and Russell 623."
 As with last week, the Russell is still our canary in the coal mine and they are lagging by a mile at 580, having dropped 4% in the past 30 days while the other indexes are up 1.5-3%. The Russell was up 2% for the week and about a point behind the others so it's either catch up or become a drag in next week's trading and we'll be watching those small caps closely for signs that we can finally break on through to the other side of our upside targets.
I reviewed our trade for the week (which were fantastic, for the most part) but lost the post and there's no way I'm doing that again so suffice to say all is going according to plan as long as we don't bust higher on Monday. We're generally not happy until we see Russell 600 and the Dow Transports over 4,000 (now 3,852) and we took a 55% bearish stance into the weekend because we'll feel a lot less silly being burned by a move up than we would if we weren't bearish enough for a move down. It would be nice to be able to make more of a commitment but the bulls clearly have the bears cowering in fear so we'll just patiently wait and see how far they can play things out.


