OK, I got a new toy today so I’m going to put up some charts!
Rather than my usual spreadsheets, I thought a visual representation of what I think is going on would be appropriate. So far this week, we have failed to break my levels, which were predicted by our own 5% rule way back in July. I don’t have a drawing tool for the 5% rule but I’ll try to give you an idea of what I see when I look at a chart, now that I can capture them for you.
First of all, let’s look at the S&P, which the analysts are ga-ga over as they make a 50% retracement of the March dive:
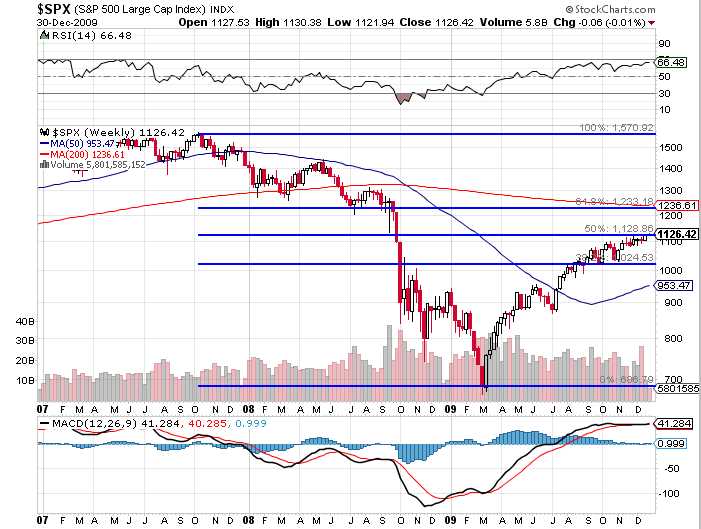
Notice the 50% mark is right about our 1,127 watch zone but we didn’t get 1,127 from that spot, we calculated 1,127 as it was a 30% move off the real floor of 867, which is our 5% rule drop. The 5% rule sensibly tells us to throw out spikes and, while it’s hard to think of a 3-month, 200-point drop as a spike, in the grand scheme of things it still is. Here’s how the same Fibonacci series looks if we take 867 as a bottom, rather than 666:
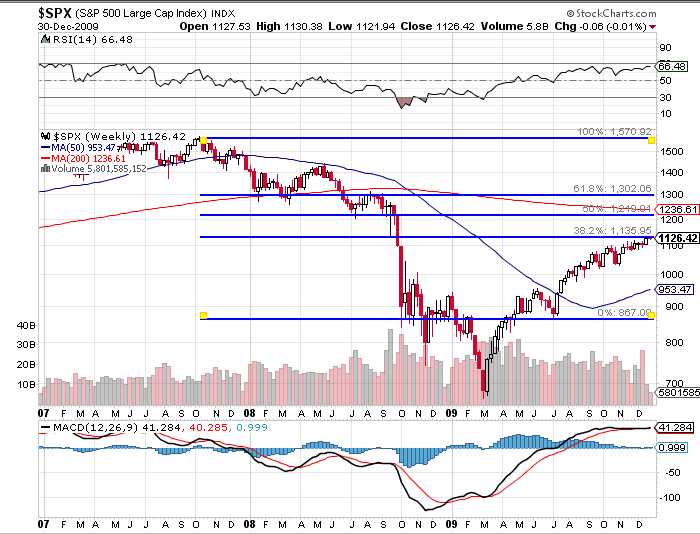
Not quite as impressive a recovery is it? Do you see how the adjusted chart makes far more sense on the way down – with support at the 61.8% line, then at the 50% line and then clearly at 0. The big difference is, in my view of the action, it has been an easy slog to make the effectively dead-cat bounce back to 38.2%. This recent action proves nothing as we have yet to test 1,135, which should provide heavier resistance. It’s going to be a long time before we do a "life cross" (where the 50 wma moves above the 200 wma) so that 1,220 mark is going to weigh very heavily in the future as well, probably all the way into August before the S&P is ready to make a real move up (assuming we don’t fall down in between).
Running the same series on the Dow, we get this:
.jpg)
Of course the problem with the Dow is that the Dow we have now is NOT the same Dow that fell last year. We jettisoned GM and C for CSCO and TRV – a very good trade that added about 70 points to the index and makes the Dow hard to plot. The changes came on June 8th and I’m going with what passes for our old drop line of 8,217 (stock charts only lets you drop the Fib lines at certain levels), which was EXTREMELY useful to us on the way down and again in the spring but we’re not going to sweat the Dow over our line by a few and it’s a long way from 10,457 to 11,147 isn’t it?
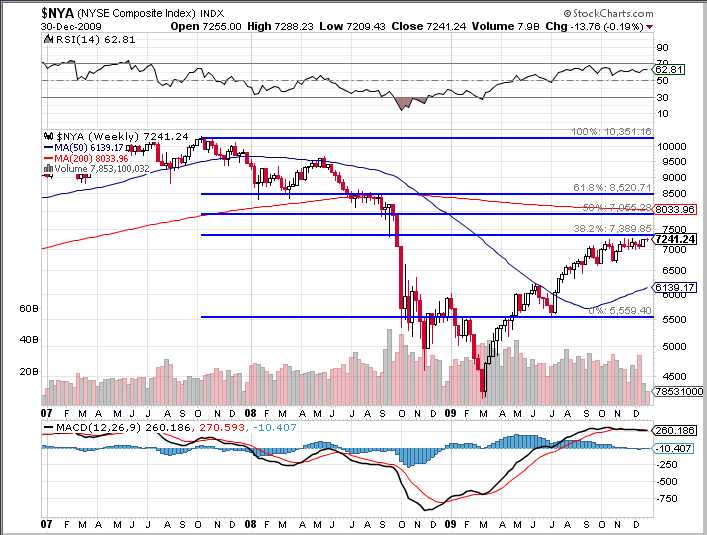
Now check out how well the NYSE conforms to the 38.2% mark:
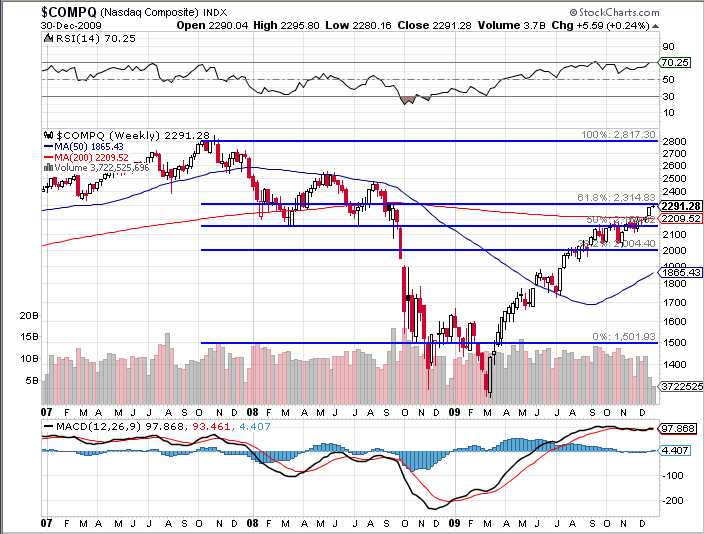
The Nasdaq has been our breakout star and if they can get over that 61.8% line at 2,314 then I’m willing to believe the others may follow them higher but they are so far ahead that it is possible they will be leading the charge back with a 15% drop to 2,000 by March 31st, just in time to meet the (hopefully) rising 50 wma:
Finally, of course, we have the Russell which, like the Nas, is overachieving:
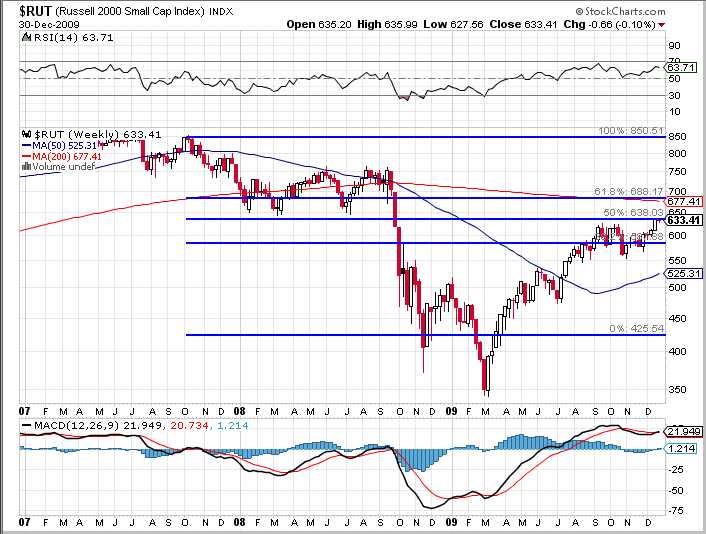
This was a tough call on the bottom so I went with 50% off the top, which seems to work out on the way down and now, the 50% line also looks good at 638.
So, in short – we have the Nasdaq in the lead, all the way up at the 61.8% line at 2,314 with the Russell in 2nd place – looking for 50% at 638. In much weaker shape are the Dow, looking to hold on top of 38.2% at 10,457 followed by the S&P looking for 1,135 and the NYSE needing 7,389. These are close enough to our 5% rule targets that it’s not worth quibbling about and keep in mind I can’t make exact placements on the Fibs so certainly close enough under the circumstances.
Lack of volume remains my main concern as it’s very possible that every single point gained in the past 2 weeks was total BS but we’ll find out soon enough next week when some real volume should return and, since all volume has been down volume since September – I’m maintaining a bearish stance until then.
Happy hunting and happy New Year!
– Phil


