What's going to happen next?
That's the main question I get from people. I find it interesting that so many people want to believe that I can see the future but I suppose that's been the same for thousands of years – people want to know what's going to happen and they are willing to put their faith in someone who's just a little more insightful than they are. This isn't unique to stocks, my old consulting company was called Delphi Consulting – also taking advantage of my reputation as a business prognosticator.
While I do pride myself on my ability to spot trends early AND to figure out how to make a buck playing them (you can see how I did last year in our 2009 Review) – I don't like it when that part of my reputation distracts from my general message, which is that NO ONE, not me, not Cramer, not anyone, can tell you what is going to happen next in the markets and the best strategy you can follow is one of maintaining a balanced, sensibly hedged virtual portfolio that can make money in ANY market direction.
This weekend, in member chat, we were discussing an excellent presentation by James Montier, now of GMO, who listed "Ten Lessons (Not?) Learnt," which is a must read for all my Members, as it lists and expands on 10 themes that echo what we discuss every day at PSW – things every investor needs to hear and understand before they go chasing off after the next guru who promises to give them a peek at the future (emphasis on my 5 favorites):
- Markets Aren’t Efficient
- Relative Performance is a Dangerous Game
- This Time is Never Different
- Valuation Matters (in the Long Run)
- Wait for the “Fat” Pitch
- Sentiment Matters
- Leverage Can’t Turn a Bad Investment Good
- Beware of Over Quantification
- There is No Substitute for Skepticism
- The Benefits of Cheap Insurance
In short (since this is not supposed to be a philosophical article) neither James Montier or I can predict the future. I can't speak for the thousand other bozos who tell you they can but we're telling you, for a fact, that we cannot. So, bearing that in mind, let's look at a few trends that we'll be watching in 2010 and examining the possibilities of their outcome…
Let's begin with something relatively easy to predict – the short-term. This morning we have a huge bump in the futures, with the Nasdaq (at 7am) back to it's Friday futures high and up 20 points from the low on Friday. The Dow and S&P are also strong but not as pumped up as the Nasdaq. I'm not sure what's up with the Nas yet but the Dow and S&P are clearly up as oil has flown to $81 and gold to $1,120 (copper $3.43) as the dollar was savaged into the EU open, falling to $1.625 to the Pound and $1.44 to the Euro while somehow maintaining 93 Yen.
This magical move by the dollar has sent commodities flying and the Dow, which is now heavily weighted to follow oil with the addition of CVX, is getting a nice run out of it. Last year, Israeli jets attacked Hamas targets in the Gaza sending oil flying up to $48 a barrel to start the new year. This year, we have Al Qaeda activity and (surprise!) cold weather being blamed for boosting crude along with, of course, CHINESE DEMAND. Combine all that with a suddenly weak dollar and the oil pushers can pocket an extra $180M on today's global barrel sales. Here's what happened to the Dow last year around this time:
Our top concern with this December's rally has been the low-volume moves up, especially as 90% of our gains have been coming in pre-markets with the majority of actual trading coming to the downside as all the new suckers coming into the tent miraculously find plenty of willing sellers, even in this "hot" market. Notice how the return of volume in January (5.2Bn per day vs 3.2Bn per day in the prior 8 sessions) became the market's undoing. Sticking to our targets last year saved us from making a mistake in January so let's take our levels VERY seriously as we begin again in 2010.
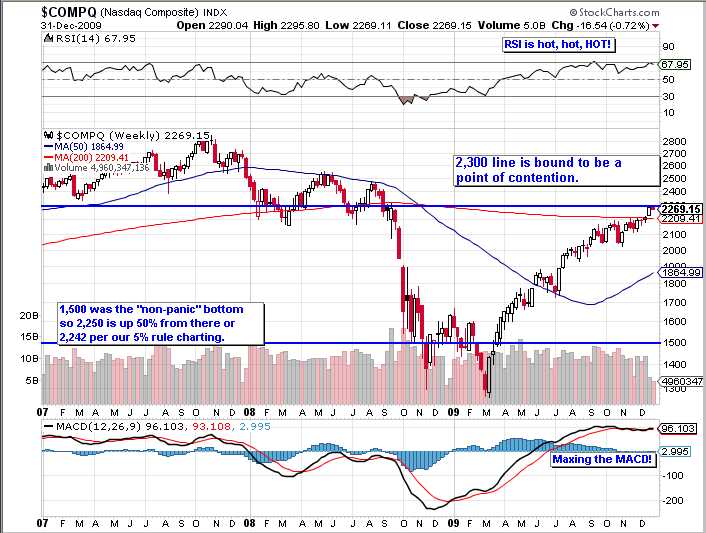
We don't like a commodity rally anyway as it only serves to further impoverish an already on-the-ropes population so we're going to remain skeptical until our upside target levels get broken. Those levels we discussed last Wednesday, when I posted our "Last Charts of the Decade" and we refined them in Thursday's Level Alert to Members as: Dow 10,549, S&P 1,135, Nasdaq 2,314, NYSE 7,389 and Russell 638. The bullish support levels we'll be looking to hold this week are Dow 10,457, S&P 1,127, Nasdaq 2,242, NYSE 7,380 and Russell 630, all of which are already blown other than the Nasdaq, who are off in their own special place at the moment.

What's it going to take for the Nasdaq to regain it's former glory of 2,800 (which, we should keep in mind, is still 45% off the March 2000 highs)? Well, in 2007, when the Nasdaq hit 2,800, we thought tech sales were going to the moon, we thought everyone in China and India would have an IPhone or a Blackberry and we thought they'd all go home to work on their laptops while watching high-definition plasma televisions and that was the basis of those very bullish tech multiples we were seeing.
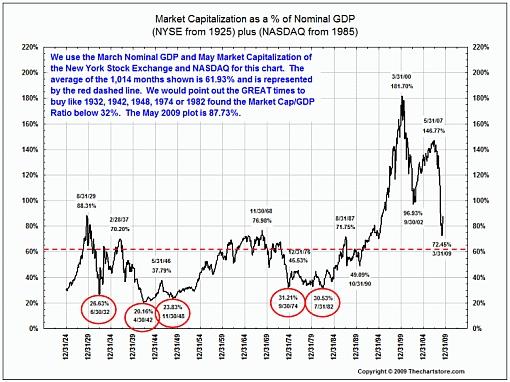
 As you can see from the chart on the left, our little spike in the Nasdaq this past month has put the capitalization to GDP ratio of the NYSE and Nasdaq back over 100% – well above historical highs. As a fundamental investor, this just rubs me the wrong way and I have very serious concerns that the earnings numbers we see this month will not be able to support what is already becoming bubble-like market behavior as expectations have far outpaced the actual improvements in corporate earnings.
Last year we had low (make that NO) expectations going for us – setting the bar so low that not even GM was able to disappoint investors with their actual numbers. Any CEO who's outlook managed to avoid the term "Seventh Circle of Hell" was showered with praise (and bonuses) for brilliantly cutting costs (and jobs) low enough to show a profit, despite the weaker sales. Can we skate by for another year on that BS? Maybe, but is that BS enough to give us another 20-25% up year in the markets? Probably not…
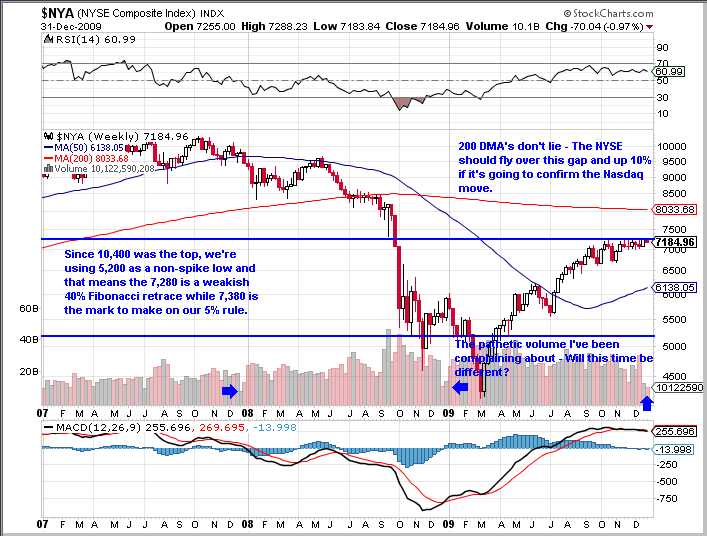
Turning to the much broader NYSE chart (also weekly) we see that the picture is nowhere near as exciting as the Nasdaq looks (and I have often pointed out how a dozen stocks account for over 1/3 of the Nasdaq's movement) although they have equally stressed RSI and MACD lines – indicating a pullback is far more likely than a breakout:

If the market move is true then there is literally nothing (resistance-wise) preventing the NYSE from driving up to its 200 dma at about 8,000. The S&P (another broad index) has virtually the same chart with a breakout around 1,130 but if we call 850 the non-spike low, then we need 1,190 just to get a 40% bounce. Either way, that 200 dma is 100 points of air away if we're going to confirm the tech move. The Russell works out amazingly well, with 630 being 40% up from the 450 line we use as the nominal low and that also intersects with our 5% rule marks so we'll be keeping a very close eye on the Russell, which has been playing with that line since Christmas.
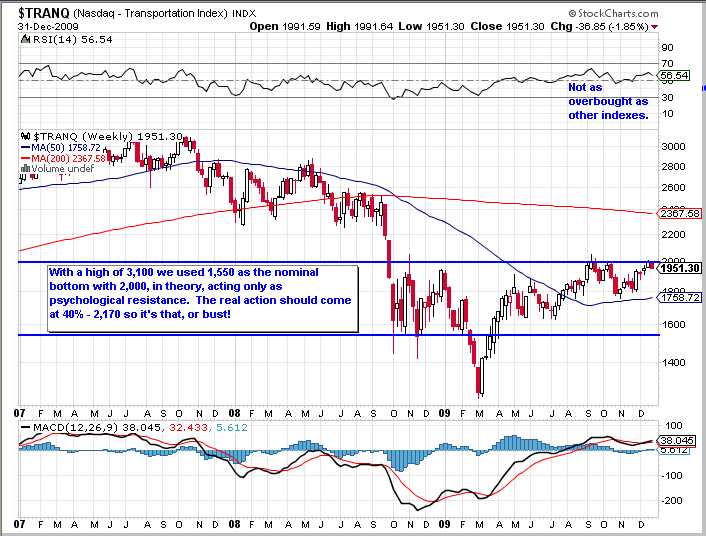
The SOX are running parallel with the Nasdaq and our other major point of contention is going to be the Transports, with the Nasdaq Transportation Index ($TRANQ) not looking impressive at all as it has continuing trouble with the 2,000 mark.

So that's pretty much what we'll be looking for this month as the volume returns (we hope!) to the markets and gives us a better indication of what is real and what was just fluff for the end of the year. The Fundamental Analysts had a nice overview of the continuing market concerns so far be it for me to beat a dead horse and he also had this nice chart, which puts the last two years very much in perspective as we all could have pretty much taken a long vacation except for one pesky mathematical fact: When you fall from 100% to 50% in 2008, a 50% recovery in 2009 only brings you back to 75%. This is why Warren Buffett's Rule #1 to investing is "Don't lose money" – it can be really hard to get it back…
So, from 75%, we need another 33% move up just to get back where we started 2008 – a pretty tall order for 2010, especially as we start the year with the handicap of 10% unemployment and no new President to get all enthusiastic about. This morning the markets are enthusiastic about a 56.1 reading on Chinese PMI (anything above 50 is expansion) and that is fueling speculation that the Yuan may rise against the dollar and is pushing the dollar lower this morning. Since Wen Jiaboa just said recently that they will NOT float the Yuan – I'll have to go against the speculators on this one.
Neither the Hang Seng (down 0.23%) nor the Shanghai (down 0.4%) were all that excited about the news but Europe was loving it this morning and markets there are up a point, just ahead of a US open that's looking to give us about the same. We don't care where we open this week, we just want to see what sticks. We get our own look at Construction Spending at 10am, along with our own ISM index with Factory Orders, Pending Home Sales and Auto Sales coming in tomorrow.
Wednesday we get the ADP Report, Challenger Job Cuts, ISM Services and, of course, Crude Inventories. Thursday brings us Jobless Claims and Friday is the Big Kahuna, with Non-Farm Payrolls (maybe a positive number?), Wholesale Inventories and Consumer Credit. With Job expectations running hot, Wednesday's ADP Report will be critical but hope may spring eternal all the way into Friday's jobs numbers, which will make or break January I imagine.
Strap in – it's going to be a wild ride – THAT I can predict!


