Lagging GDP Confirms Consumer Slowdown
The Information that was Missing from Last Friday’s GDP Report
[See also my interview with Rick, here. And more on Rick’s data, here. – Ilene]
Courtesy of Richard Davis of the Consumer Metrics Institute, Inc.
The April 30th GDP report issued by the Bureau of Economic Analysis ("BEA") of the U. S. Department of Commerce was a freeze-frame quarterly snapshot of a highly dynamic economy — an economy that another source indicates was in significant transition while the snapshot was being taken.
Compared to the 4th quarter of 2009, the annualized growth rate of the GDP had dropped by 43%. Depending on your point of view this could be interpreted either as a glass that is "half-full" or a glass that is "half-empty":
1) The "half-full" reading would mean that the GDP numbers confirm that the recovery had at least moderated to a historically normal growth rate. In this scenario the good news would have been that "the economy is still growing," albeit at a historically normal rate. The bad news would have been that a normal growth rate would only warrant normal P/E ratios in the equity
markets.
2) The "half-empty" reading would have meant that the near halving of the GDP’s growth rate confirmed that (at the factory level) the economy had finally begun to "roll over". If so, the BEA’s announcement portends even lower readings in the quarters to follow.
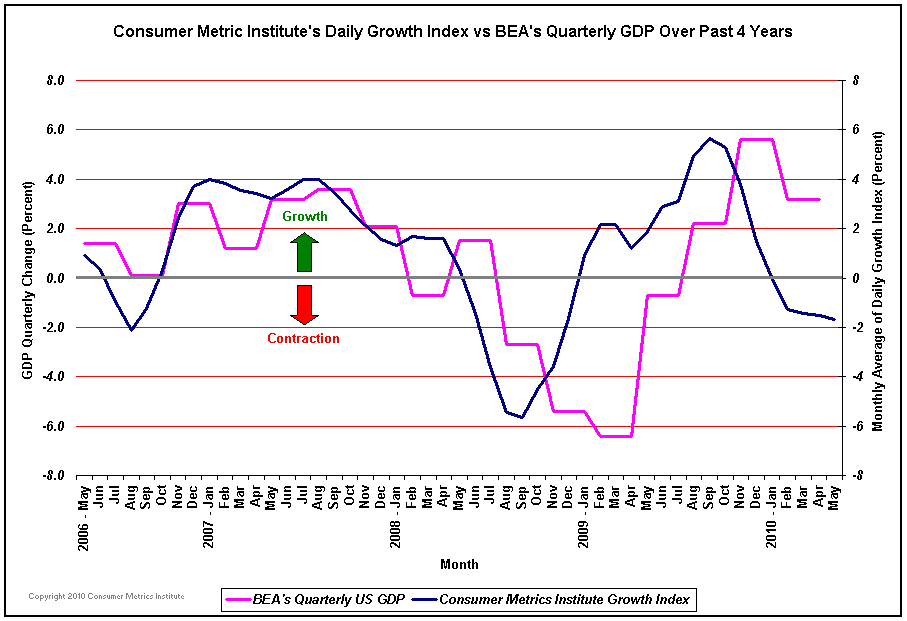
What was clearly missing in the "half-full/half-empty" debate was a feel for whether the level seen in the snapshot’s glass was stable or still dropping. At the Consumer Metrics Institute our measurements of the web-based consumer "demand" side economy support the "half-empty" reading of the new GDP data. The new GDP numbers (which are subject to at least two revisions) agree with where our "Daily Growth Index" was on November 24th, 2009, 18 weeks prior to the end of 2010’s first calendar quarter — and when that index was in precipitous decline.
Our indexes capture consumer activities in the "demand" side of the economy by mining consumer internet tracking data on a daily basis. This consumer "demand" flows downstream economically to the "supply" side factories over the following 18 weeks:
http://www.consumerindexes.
A look at our "Daily Growth Index" also shows that towards the end of November 2009 the "demand" side economic activity was dropping so quickly that a two week change in the sampling period would make a huge difference in the numbers being reported. If the sampling period had shifted to two weeks earlier, the reported GDP number would have been 4.4%, substantially higher. However, if the sampling period had shifted to two weeks later, the GDP growth rate would have been only 2.0%, less than half the reading from only 4 weeks earlier. This is the sign of an economy in rapid transition.
The methodologies used by the BEA when measuring factory production are ill suited to capturing an economy in such rapid transition. In the 4th quarter of 2009 the production side of the economy was topping (reflecting the topping of our measurements on the demand side in August 2009). The first quarter’s production environment was at a much more dynamic spot in this particular economic cycle, and the subsequent monthly revisions by the BEA may be significant.
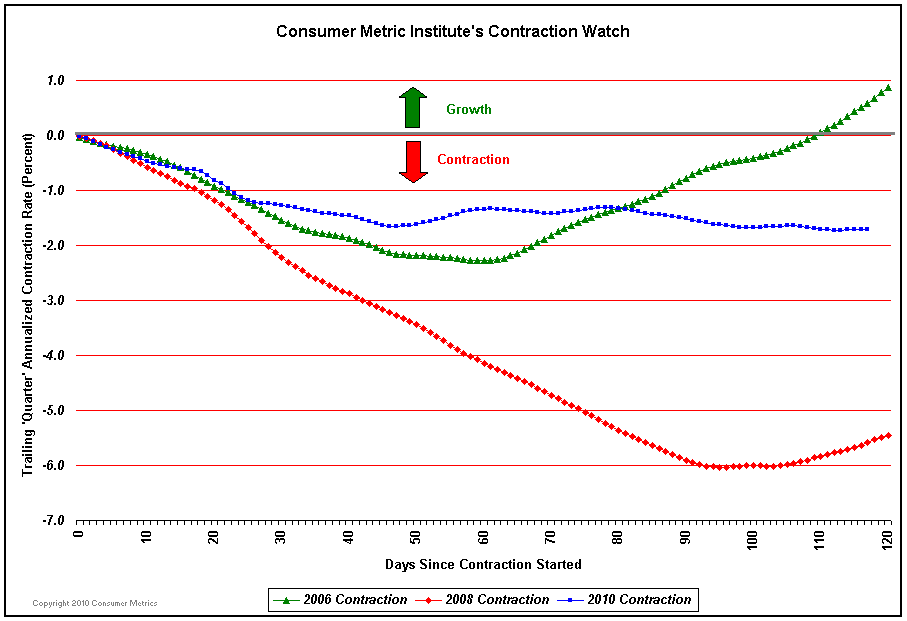
From our perspective the GDP is only confirming where our numbers were in November — which is, relatively speaking, ancient history. Since then we have seen our "demand" side numbers slip into contraction (on January 15th), and they have recently lingered in the -1.5% "growth" range (see charts below). We have long since recorded the "demand" side activity that has been flowing downstream to the factories during the second quarter of 2010. If the GDP lags our "Daily Growth Index" by 18 weeks again we should see the consumer portion of the 2nd quarter 2010 GDP contracting at a 1.5% clip, less inventory adjustments:
http://www.consumerindexes.
As you can see from the above chart the current consumer "demand" contraction event is unique: if there is a "second dip" it may very well be unlike anything we have seen recently. Instead of a "call-911" type of event in 2008 or the "hiccup" witnessed in 2006, we may be seeing a "walking pneumonia" type of contraction that has legs.
Our data is significantly upstream economically from the factories and the products measured by the GDP, putting us far ahead of the traditional economic reports. Perhaps our data is too timely; we are so far ahead of conventional economic measures that our story generally differs (either positively or negatively) from the stories being simultaneously reported by
more traditional sources.
The indexes themselves can be found at http://www.consumerindexes.com
Thank you,
Richard Davis
Consumer Metrics Institute, Inc.


