Courtesy of Lee Adler of the Wall Street Examiner

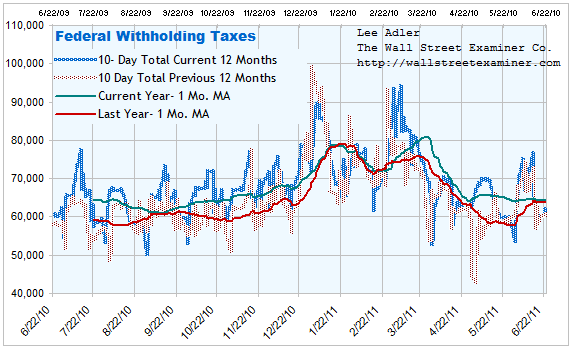
I wanted to follow up with you on the June 17 report on Federal Withholding Tax collections, which I cover regularly in the Professional Edition Treasury Update (latest report here). I like tracking withholding taxes because they are one of the only economic barometers that we can follow virtually in real time on a daily basis. The charts below contain daily data through June 23. If you are a Professional Edition subscriber this is largely redundant data, but there are two new charts and one new critical fact which I think tell the story better and will show you more clearly just what’s going on. I will include these charts in the regular weekly updates in the Professional Edition.
The first chart shows this year and last year superimposed on one another. The blue shaded line is this year. The brown shaded line is last year at the same time date. That this year has had gains versus last year most of the time as indicated by the spread between the two lines. However, that has begun to change in recent weeks, with this year no longer showing material gains versus last year.
I was wondering how much of the gain was due to inflation, so I calculated the year to year difference and then adjusted it by the government’s employment cost index annual rate of change. That measure has been consistently running around 2%, which is lower than the CPI (surprise, surprise, surprise). The resulting chart is below.
There are some interesting points to be gleaned from this, once you get past the day to day volatility and just look at the cycles. First is the decline in the linear regression over the course of the year from the 4% area to around 3%. That still is not bad as a real rate of gain, but down is not as good as flat, or up, and there’s been a great deal of variation. Before this, there have been good excuses for any negative periods, but not this time. Let’s look at each swing.
In the summer of last year things looked good comparatively speaking because the comparisons versus an extremely weak 2009 were easy. But then in August there was a stall. With the growth rate suddenly going negative in early August as the stock market was beginning to peel off points, the Fed announced what I’ve been calling QL1.5 or Quantitative Leveling 1.5, the precursor to QE2. Tax collections then started to recover. Coincidence? I don’t believe in coincidences when it comes to these things.
Then in mid November the Fed floored the accelerator with QE2. That worked for a while, with the growth rate averaging 5-8% until Christmas. The Administration and Congress then cut a deal to cut payroll taxes beginning in January. Collections plunged as a result, but it was due to the tax cut, not an economic decline, and the theory was that the cut would stimulate growth.
Beginning in March, the theory seemed to be working as withholding tax collections surged versus last year around the same dates, with a spike to a 50% gain for a couple of days in early May. But that was an illusion partly because of a plunge in collections last year when census workers got laid off. But even with that, the surge was sizable and it persisted until the middle of May.
Then things fell apart. The government was peeling off its stimulus programs, gas and food prices had skyrocketed, and suddenly on May 17 tax collections fell versus the same period last year. Since then, the difference between last year and this year has been near zero in real terms. That drop versus the strong gains in March and April suggests that the US may have entered recession a month ago.
I’ve reached that conclusion, rather than expecting another up cycle for several reasons. First, the Fed, recognizing that the disastrous unintended consequences of QE were far more damaging than any benefit from higher stock prices, had concluded by April that QE must end. It is likely to stay off the playing field until crisis conditions reach a crescendo. Furthermore, politicians, in their infinite wisdom, have now decided to cut the only thing creating the illusion of economic growth, which is massive borrowing to fund current spending. Any further reductions in the budget here will only enhance the downward momentum.
It’s going to be an interesting summer.
I’ll follow the story and tell the tale weekly in the Fed and Treasury reports in the Professional Edition. I hope that if you already have not done so, you will Click this link to try WSE’s Professional Edition risk free for 30 days!
Pic Credit: Jr. Deputy Accountant


