Courtesy of Lee Adler of the Wall Street Examiner
October 5, 2012 – The BLS today reported a gain of 114,00 in nonfarm payrolls. That compares with a gain of 574,000 in the actual, not seasonally adjusted (SA) number. In the actual (NonSA) data September is always an up month. Last year the September NonSA gain was 697,000. In 2010, it was 496,000. The 10 year average gain for September for 2002 to 2011 was 533,000. This year’s September gain came on the heels of very strong NonSA gains in August.
Unlike the August SA number, which had a big upward revision, note that the August NonSA number was not revised. There’s a problem with the seasonally adjusted fictional number, not with the actual NonSA data. The SA number for this month will subsequently be revised for the current month in each of the next 5 years as the BLS attempts to fit the SA number to the actual change. It will also have a major benchmark revision in February, when the benchmarking process is finalized.
Fox News and Jack Welch are accusing the Administration of cooking the books. Ironically, last month I complained:
The Bureau of Labor Statistics (BLS) must be staffed with Republicans. There’s something wrong with the headline number this month. It is consistent with the pattern of the past 5 months where the seasonally adjusted (SA) headline numbers appear to understate the trend of the actual, not seasonally adjusted (NSA) numbers.
A few weeks after I posted that, the BLS came out with its preliminary benchmark revision announcement that it had underestimated growth from April 2011 to March 2012 by 386,000, and that as a result of the new benchmark all of the previously published data for 2012 would also be revised up.
Lo and behold the August SA headline number has now been revised up by 46,000 and July has been revised up by 40,000. The BLS headline number is really lousy data, but the market pays attention to it. We need to look at the best data we can find to know the truth about what’s going on. That means watching things like the withholding tax data and actual, not seasonally adjusted first time unemployment claims trends.
The BLS will revise this month’s number, not only next month and the month after, but every year for the next 5 years as they hone the SA number to include a look back to pinpoint where this month’s number actually should have been. The truth is that the current SA number is a wild guess and a fraud. It’s wrong, and the BLS statisticians know it and have publicized that fact, but the mainstream media has ignored the warnings for years.
So let’s get real, ok. The SA data is unreal. The actual NonSA data is much closer to real. The withholding tax collections are really real, but from time to time may be skewed by IRA distributions, so we need to be alert for anomalies in that data.
The numbers above come from the BLS the Current Employment Statistics Survey or CES, a survey of business establishments. The BLS also does a survey of households. To further complicate matters, the household survey or CPS — Current Population Survey– often tells a different story from the establishment survey.

In the CPS, September is a month in which the actual NonSA number usually decreases. This year the number of persons reported as employed in September rose by 775,000 from August, not seasonally manipulated. That compares with a gain of 167,000 in September 2011 and a drop of 204,000 in 2010. The average loss in September for the previous 10 years was -343,000.
The 2% year over year gain is consistent with the gain shown by withholding taxes. By this standard this was a very good month. There was little discrepancy between what the withholding tax data suggested and the BLS actual NonSA survey data. If anything, the withholding data suggested a stronger number, but it may have been skewed by non-payroll related factors.
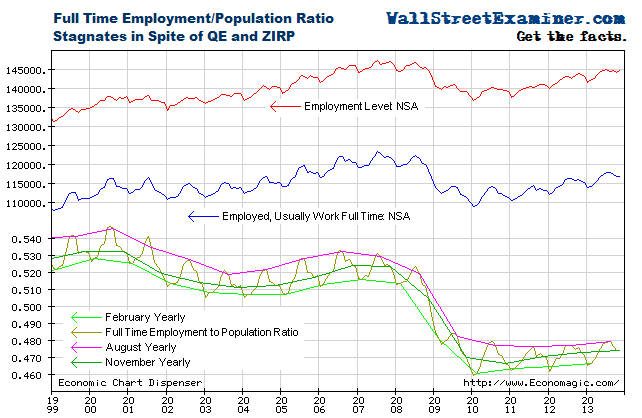
I like to focus on full time rather than total employment. Part time jobs are nice, and for many that hold them, they are a lifeline, but the important metric here is full time jobs. Without those, we’re dead.
As opposed to the gains in total jobs, full time employment in the CPS was down by 536,000.
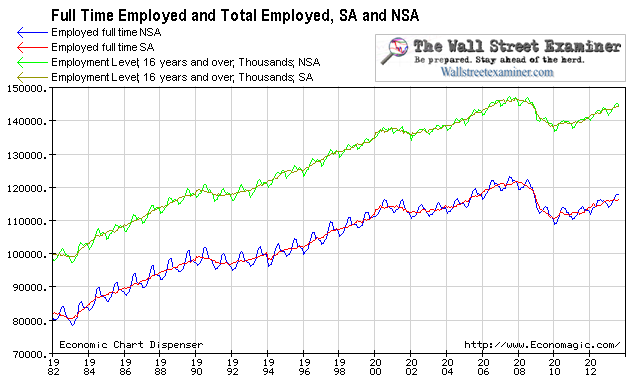
Part time jobs increased by 1.3 million. That reversed a shift over the summer where part time jobs shrank by 1.75 million. This is not about a sudden deterioration in the jobs market. It’s about kids with full time summer jobs going back to school and shifting to part time work. Even though the number working full time dropped by 536,000 in September, the total of 115.7 million is 1.1 million more than were working full time in May, before summer vacations started. Last year over the same time frame the gain in full time jobs was just 362,000. This year’s gain was also far superior to the 10 year average of 350,000.
The chart above gives some perspective on how far total employment and full time employment fell in the first stage of this depression, and how much they have yet to recover. The BLS applied big upward revisions to the seasonally adjusted (SA) fiction for July and August bringing it closer to the trend, but it is still a little behind. That should be corrected to some degree in February when the annual benchmark revisions are applied, but the SA line will not fully conform to the trend for another 5 years. Note that prior to 2007 on this chart, the SA lines perfectly mimic the year to year trendlines. That’s because all the revisions have been finalized for those years. This year’s line is still constantly shifting in response to new data and subsequent revisions. The SA line for this year will not be final until 2017.
Seasonally adjusted numbers frequently veer away from reality by the very nature of the arbitrary seasonal adjustment process. ‘Conomists and the media focus almost entirely on this nonsense, which attempts to compare one fictitious number with another fictitious number to derive a fictitious month to month change. Meanwhile they ignore the actual data and ridicule analysts who complain about the misleading nature of the SA data.
If they are going to emphasize the seasonally adjusted fiction, they could at least check it against the trend of the real data, the not seasonally adjusted (NonSA) data as shown in these graphs.
The chart below shows the year to year trend line connecting the September data in full time and total employment along with the raw NonSA data, and the SA fiction. The seasonally finagled data shows the trend catching up in both series due to the big upward revisions to the July and August data. Prior to this, from March through August the SA line had been diverging from the actual trend, particularly in full time employment.
Unlike technical analysts who actually know how to read patterns and trends in noisy data, the vast majority of mainstream ‘conomists who have sold their souls to the devil (CNBS) seem to have no clue how to to do that. Instead, they use the idealized, overly complicated SA data which obscures the truth. But the public gets it. They can tell by how they, their friends, families and acquaintances are faring in the real world.
June or July is usually the peak month for both total and full time employment. This year the numbers broke last July’s level in April. The economy was a couple months ahead of schedule in affirming the uptrend in jobs. That uptrend is still firmly entrenched, even in the full time jobs including the September decline. The gains have clearly accelerated in 2012 versus 2011. The idea that the economy slowed in 2012 is hogwash. With QE3, the Fed is adding more fuel to a fire that was already beginning to burn hot.
If we had thrown out all the confusing numbers and just looked at the actual data on the chart, it was clear that the trend was improving in August. But Wall Street wanted more QE, and the headline numbers through August were just coincidentally playing to what the Street wanted. I wrongly thought that the Fed knew better and wouldn’t act. I gave them too much credit.
The withholding tax data shown below also suggested that something in the labor picture is still undergoing consistent gains, regardless of what the SA data says. Increasing withholding tax collections of 2% in real terms are growing at double the rate of population growth. Stronger economic data immediately ahead may be good news for stocks in the short run, but will probably ring the death knell for bonds.
Stock market performance is at the mercy of the Fed (Or over the past 12 months the ECB, not shown), and employment typically reflects them both. While at times there’s a lag, the linkage is undeniable. Over the past year, the SOMA has not reflected the impact of the Fed’s MBS purchases from the Primary Dealers, a subject which I cover in depth weekly in the Fed Reports. The graph of Fed purchases from the Primary Dealers has been rising steadily since last September. By cashing out the dealers via these MBS buys, the Fed enables the dealers to buy more Treasuries. The next week, the Treasury spends that cash. That’s how Treasury debt is immediately transformed into economic activity and slow and steady job creation. With new QE, the Fed will be adding even more cash to power that trend.
This is activity that is sustained only by increasing government debt, and only as long as the Treasury Ponzi remains intact. But it does remain intact, and it’s resulting in steady gains in employment, including full time employment over the past year. The game should continue until the Fed picks up the marbles or until the other players run out of chips, which probably won’t happen as long as some players are running away from the European gaming tables to play at the US casino or either the Fed or ECB continue to pump liquidity into the system.
Average Weekly Earnings and Hours Worked
Updated October 5, 2012.
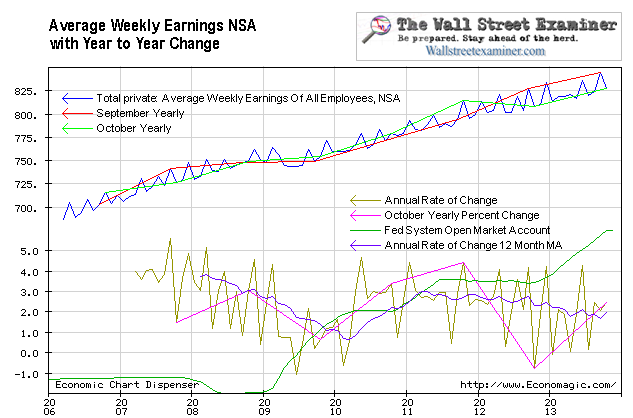
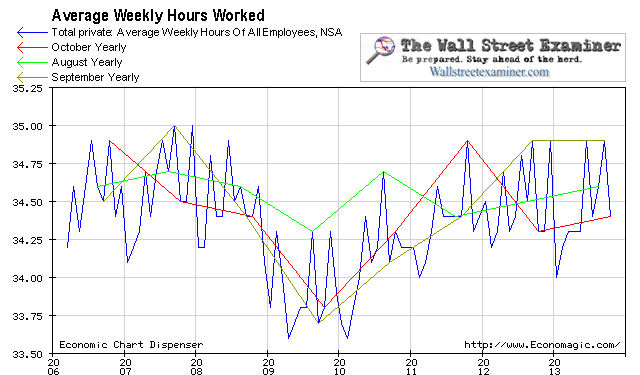
Average hourly earnings were up 2.5% y/y in September, accelerating from 1.8% in August. Average weekly earnings were up 4% versus 2.1% in August. Average hours worked were up 1.5% versus 0.3% in August. Therefore the gain in weekly earnings is mostly due to rising wage rates, and to a lesser extent an increase in average hours worked. This is evidence that inflationary pressures are building while the Fed drives in the rear view mirror.
The uptrends in hours and earnings could be a sign that the labor market is tightening in spite of the huge numbers of people out of work. The issue may be that many of the unemployed do not possess the skills that are in demand in the market. Mortgage application takers and processors, and construction laborers generally do not make good computer game programmers. Economic pundits must face the fact that the 10 million fake jobs spawned by the bubble are not coming back. The 7.8% unemployment rate is probably “normal.” The bubble unemployment rate of 5.5% was abnormal.
Get regular updates the machinations of the Fed, Treasury, Primary Dealers and foreign central banks in the US market, in the Fed Report in the Professional Edition, Money Liquidity, and Real Estate Package. Click this link to try WSE's Professional Edition risk free for 30 days!
Copyright © 2012 The Wall Street Examiner. All Rights Reserved. The above may be reposted with attribution and a prominent link to the Wall Street Examiner.


