Reminder: Sabrient is available to chat with Members, comments are found below each post.
Courtesy of Sabrient Systems and Gradient Analytics
I was supposed to be in New York City this week, but Sandy the super storm had other ideas. Some writers are suggesting that since the storm has passed, we can all start getting back to business. But of course, some densely-populated areas In New York and New Jersey have been so devastated that normalcy is a long ways off. Staten Island, for example, was right in the bull’s-eye of the storm, but is largely still awaiting assistance. Desperation abounds.
With Election Day arriving next Tuesday, a logical question is how the massive storm hitting mostly Democratic (“blue”) states might impact the presidential election. Some believe that it allows President Obama the opportunity to stop campaigning and display himself as our strong and caring leader, to his advantage. On the other hand, some believe that the storm will reduce voter turnout among those who were less likely to go to the polls under the best of circumstances, which would play to Governor Romney’s advantage. Furthermore, the election might become a referendum on the role government should play in our lives—including disaster relief.
Instead of flying to New York as originally planned, I drove down to Los Angeles a couple of times this week, and I was struck by the eerily light traffic. My theory is that we are so interconnected that a major storm on the East Coast can impact traffic on the West Coast, at least partly because of the rash of canceled flights. The stock market closure on Monday and Tuesday probably played a part, as well.
I find it notable that consumer sentiment continues to rise to its highest levels in five years. And despite a weak earnings season, stock valuations are still pretty good from a historical standpoint. However, not everyone feels that way. I was at the Singular Research “Best of the Uncovereds” Conference in LA today, and one of the attendees expressed his opinion to me that all stocks currently fall into one of two camps: those that are in distress and those that are soon to be in distress. He is focused on deep-value stocks to buy long, but he also is evaluating opportunities to go short. For example, his recent successful plays include investor darling Apple (AAPL).
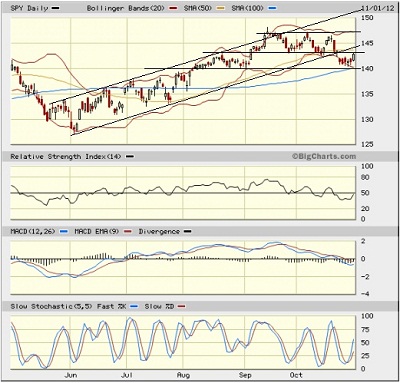
The S&P 500 SPDR Trust (SPY) closed Wednesday at 142.83. Looking at the chart, price remains below its 50-day simple moving average, the bottom of the bullish rising channel that was in place since the beginning of June, and the bottom of the sideways trading channel support line at 143. However, oscillators like RSI, MACD, and Slow Stochastic have each turned up bullishly. Price got a nice bounce from the prior support line at 140 and the 100-day moving average, so the new sideways channel is bounded by 140 and 147.

Strong support is just below at the 200-day SMA near 138. Breaking back through the 143 level and the bottom of the prior rising channel (now nearing 145) might not be easy. Nevertheless, a rally into Tuesday’s election is quite possible.
The CBOE Market Volatility Index (VIX), a.k.a. “fear gauge,” closed Wednesday at 16.69, which is still low in its historical range. All in all, this remains a bullish sign for stocks.
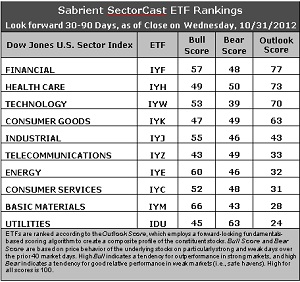
Latest rankings: The table ranks each of the ten U.S. industrial sector iShares (ETFs) by Sabrient’s proprietary Outlook Score, which employs a forward-looking, fundamentals-based, quantitative algorithm to create a bottom-up composite profile of the constituent stocks within the ETF. In addition, the table also shows Sabrient’s proprietary Bull Score and Bear Score for each ETF.
High Bull score indicates that stocks within the ETF have tended recently toward relative outperformance during particularly strong market periods, while a high Bear score indicates that stocks within the ETF have tended to hold up relatively well during particularly weak market periods. Bull and Bear are backward-looking indicators of recent sentiment trend.
As a group, these three scores can be quite helpful for positioning a portfolio for a given set of anticipated market conditions.

Observations:
1. Financial (IYF) is still in the top spot with an Outlook score of 77, as stocks within the sector continue to be supported by Wall Street analysts raising earnings estimates. It has a reasonably low forward P/E and strong return on sales, although its return on assets and return on equity are on the low side. The second spot now goes to Healthcare (IYH), which has received a surge in analyst sentiment and now scores 73. Technology (IYW) falls to third, even though its Outlook score rose a point to 70.
2. Overall, the Outlook rankings remain decidedly neutral, with the more aggressive and defensive sectors mixed about in the rankings. Moreover, the range from the top to the bottom Outlook scores have tightened significantly this week, reflecting a lot of uncertainty in which sectors will emerge as the strongest. Last week the rankings had a top-bottom range of 70, but this week it has tightened to 53.
3. Telecom (IYZ) has made a huge jump out of the cellar all the way up to sixth place with a 20-point rise in its Outlook score from 13 to 33, mainly because Wall Street has suddenly started increasing earnings estimates in the sector. However, analysts have piled on with net downgrades on stocks within Basic Materials (IYM) and Energy (IYE). The bottom of the rankings shows Utilities (IDU) with an Outlook score of 24 and Materials (IYM) at 28.
4. Looking at the Bull scores, Materials (IYM) is the clear leader on strong market days, scoring 66. Telecom (IYZ) is now the weakest on strong market days, scoring 43. In other words, Materials stocks have tended to perform the best when the market is rallying, while Telecom stocks have lagged.
5. Looking at the Bear scores, Utilities (IDU) is the clear investor safe haven on weak market days, scoring 63, which is far ahead of second-place IYH at 50. No other sectors have a Bear score above 50. Technology (IYW) remains the weakling during market weakness, as reflected in its low Bear score of 39. In other words, Tech stocks have been selling off the most lately when the market is pulling back, while Utilities stocks have held up the best.
6. Overall, Financial (IYF) shows the best all-weather combination of Outlook/Bull/Bear scores. Adding up the three scores gives a commanding total of 182. Telecom (IYZ) is the worst at 125. As for Bull/Bear combination, Materials (IYM) is the best at 109, while Technology (IYW) and Telecom (IYZ) share the worst combined score of 92.
These scores represent the view that the Financial and Healthcare sectors may be relatively undervalued overall, while Utilities and Materials sectors may be relatively overvalued based on our 1-3 month forward look.
Top-ranked stocks within IYF and IYH include American National Insurance (ANAT), Visa (V), The Cooper Companies (COO), and Watson Pharmaceuticals (WPI). Notably, Visa came through on Wednesday with an impressive quarterly report.
Disclosure: Author has no positions in stocks or ETFs mentioned.
About SectorCast: Rankings are based on Sabrient’s SectorCast model, which builds a composite profile of each equity ETF based on bottom-up aggregate scoring of the constituent stocks. The Outlook Score employs a fundamentals-based multi-factor approach considering forward valuation, earnings growth prospects, Wall Street analysts’ consensus revisions, accounting practices, and various return ratios. It has tested to be highly predictive for identifying the best (most undervalued) and worst (most overvalued) sectors, with a 1-3 month forward look.
Bull Score and Bear Score are based on the price behavior of the underlying stocks on particularly strong and weak days during the prior 40 market days. They reflect investor sentiment toward the stocks (on a relative basis) as either aggressive plays or safe havens. So, a high Bull score indicates that stocks within the ETF have tended recently toward relative outperformance during particularly strong market periods, while a high Bear score indicates that stocks within the ETF have tended to hold up relatively well during particularly weak market periods.
Thus, ETFs with high Bull scores generally perform better when the market is hot, ETFs with high Bear scores generally perform better when the market is weak, and ETFs with high Outlook scores generally perform well over time in various market conditions.
Of course, each ETF has a unique set of constituent stocks, so the sectors represented will score differently depending upon which set of ETFs is used. For Sector Detector, I use ten iShares ETFs representing the major U.S. business sectors.
About Trading Strategies: There are various ways to trade these rankings. First, you might run a sector rotation strategy in which you buy long the top 2-4 ETFs from SectorCast-ETF, rebalancing either on a fixed schedule (e.g., monthly or quarterly) or when the rankings change significantly. Another alternative is to enhance a position in the SPDR Trust exchange-traded fund (SPY) depending upon your market bias. If you are bullish on the broad market, you can go long the SPY and enhance it with additional long positions in the top-ranked sector ETFs. Conversely, if you are bearish and short (or buy puts on) the SPY, you could also consider shorting the two lowest-ranked sector ETFs to enhance your short bias.
However, if you prefer not to bet on market direction, you could try a market-neutral, long/short trade—that is, go long (or buy call options on) the top-ranked ETFs and short (or buy put options on) the lowest-ranked ETFs. And here’s a more aggressive strategy to consider: You might trade some of the highest and lowest ranked stocks from within those top and bottom-ranked ETFs.


