 Time to zoom out to a bigger perspective, I think.
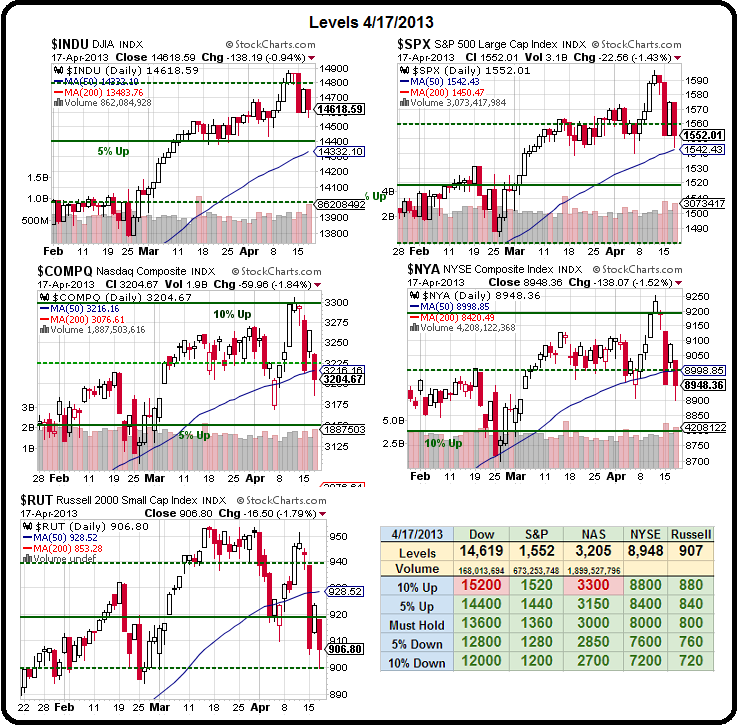
We have our ever-reliable Big Chart and our 5% levels and, as I had noted Tuesday morning, we're not very impressed until and unless we retake our strong bounce levels and, so far, we're rejected at our WEAK bounce levels across the board. As I said on Tuesday "Anything less than strong bounces on the day will keep us on the bearish side" and we did get nice bounces on Tuesday – but they didn't last 24-hours.
- Dow 14,660 (weak), 14,700 (strong)
- S&P 1,560 & 1,570
- Nasdaq 3,220 & 3,240
- NYSE 9,010 & 9,070
- Russell 915 & 930
- Transports 5,960 & 6,120
- SOX 425 & 428
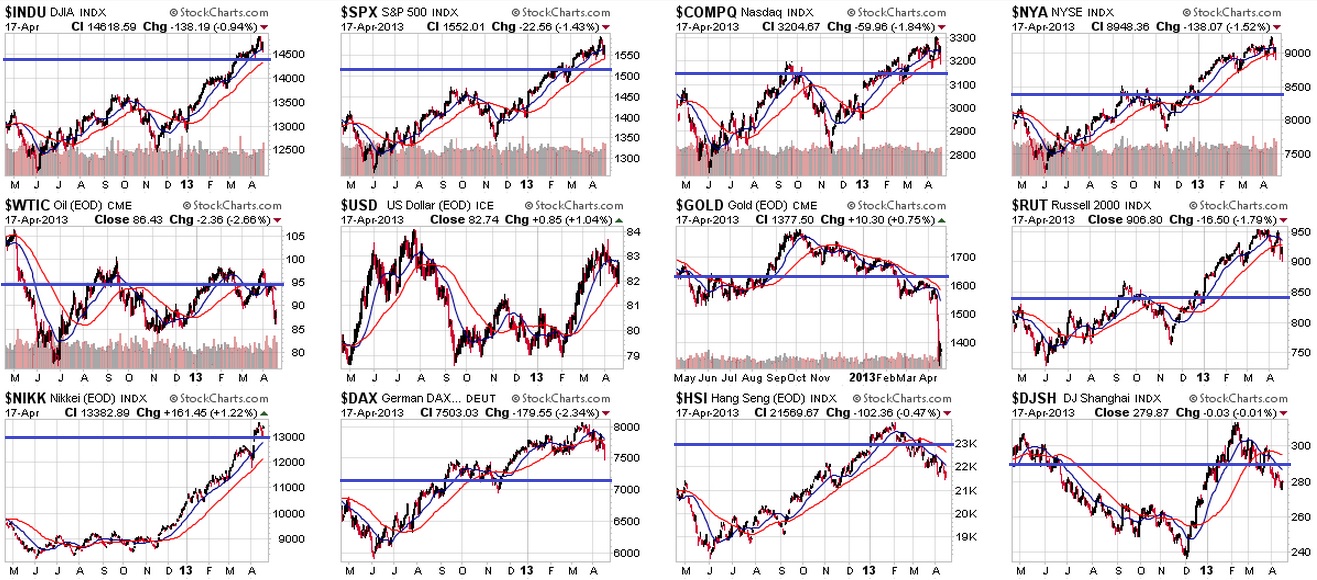
That's keeping us nervous and the VIX is nervous too, at 16.51 but that's nothing compared to real panic (mid-20s) and TLT is "only" 122.79 – not too many people panicking into 1.8% bonds either – although in Germany they're getting 1.3% and Japan is still under 1%, even with the Yen devalued by 20% since November. The BOJ plan is to PUNISH savings while the US policy is more like actively discouraging it and, in Europe – they just take it from you. All achieve the same ends – it's just the means we quibble over. Speaking of the rest of the World, let's check out the Multi-Chart:

The blue lines are our Big Chart's 5% lines extrapolated for the other indexes and those would be our "Must Hold" lines if we are to remain in bull mode. We haven't officially moved our lines yet because we haven't yet been convinced that we should. Had we broken up instead of pulling back this month – we'd be using the 10% lines for our Must Holds but those lines aren't predictions – merely indicators of where we should flip bearish if they fail. As it was, the 10% lines failed to hold and we flipped bearish before a chart adjustment was triggered. That's good because it makes us look very clever…
 As I noted in Member Chat yesterday, please do not confuse the 5% Rule with TA – it's just math. It's math based on theories of market behavior I developed when consulting on early versions of TradeBot systems and I began to notice that, no matter how differently people attempted to make their systems from their competitors, laws of human behavior, corporate behavior and coding led to certain convergences we could take advantage of. If you look at the way the indexes behave around Big Chart lines that were predicted back in the crash of 2009 – you can see how effective this system is.
We were brilliantly able to call the top on oil (USO $40, WTIC $96) but, as usual, we can't control spikes and oil hit $98.24 before finally falling back to our predicted top and now all the way down to $85.90 yesterday, where I tweeted out an end to our public call to hold oil Futures short from $96.50 and, in fact, we added a bullish play on USO to Member Chat:
USO/Lol – Not a bad idea from the historical context. June $29.50/31.50 bull call spread is $1.20 with USO currently at $31 and oil at $96.75. I'd go for that and sell puts perhaps if they go lower but, otherwise, it pays 66% if you collect the $2 – that's not bad for 2 months.
We also played Gasoline Futures (/RB) long this morning at $2.7350 and that one has given us no trouble so far and is currently $2.7698, which may not sound like much but Gasoline Futures pay $4.20 per 0.0001 and that move is 348 of those .0001s and that's good for $1,461.60 per contract – makes it worth getting up early, doesn't it?
Don't forget, we'll be doing a workshop on Futures trading at our PSW East Coast Meeting in Atlantic City in just 10 days (Sunday and Monday) – of course we have plenty of topics to cover but we did a Futures workshop in Vegas and now some of those people have become very happy quick traders – don't you think it's worth at least taking a look?
 So where were we? Oh yes, the markets… Has the Fed stopped printing money? No. Has the BOJ stopped printing money? No. Is Europe in the crapper? Yes. Does China seem like it could blow any minute? Yes. Are earnings a little disappointing – especially from companies who do business with Europe and China? Yes. Well, then nothing has changed, has it?
We are fretting over raw materials crashing but look at Dave Fry's weekly chart of XLB, which features MON, DD, DOW, PX, FCX and ECL as 50% of it's holdings. These companies actually sell materials and they are only in a mild correction. Someone is wrong and, so far, we're betting it's the miners that are oversold but we'll watch these components carefully to see if maybe we're wrong as they're still up 20% from last year's lows. Hardly seems like the Global economy is crashing if this ETF is humming along.
Don't get me wrong, there's tons of bad news out there but we had tons of bad news in 2009 and 2010 and Central Banks responded with HALF the money printing that is going on today. Clearly the money printing is less effective now than it was then but it's still printing, nonetheless and, EVENTUALLY, if you keep filling the 1% bathtub with water, you will (in theory) finally reach a point at which a little bit does spill over the side and trickle down on the little people.
Meanwhile, the top 1% (including our great Corporate Persons) are literally swimming in money with companies like AAPL carrying 1/3 of their market cap in cash. Eventually, one would think, AAPL and others will spend some of that cash.
 It is thought that the S&P companies have $2Tn in cash overall sitting on the books and, one day, they may hire someone from the bottom 99% or they may spend some money in the local economy or they may even buy back some of their stock or pay a dividend and maybe some small percentage of their shareholders are in the bottom 99%. See – TRICKLING!
Unfortunately it's a very slow trickle but a trickle nonetheless and how many Trillion more dollars will the Fed and the BOJ have to pour in before that trickle becomes a stream or even a flood if the walls break down (from holding all those Trillions in wealth) and the money finally makes it's way back into circulation?
That's the crux of our bullish premise on the economy and, like the trickle, it's pretty thin but it is there and anyone who's been to the Grand Canyon can attest to the power of a trickle over time. We're just going to have to give it time – unless the Government does something crazy like spending money on infrastructure to directly create jobs or if the EU wakes up and begins LENDING money to nations with struggling economies instead of telling them to tighten their belts.
It could happen…


