Courtesy of Michael Krause’s Market Take.
Time to Short Bonds and Crude: Historic Analysis of Crude against 30 Year Spreading
In a conversation with a trader friend of mine today, he casually noticed the seemingly inconsistent manner in which the 10 and 30 year bond climbed as the equity/economy fear trade continued despite oil screaming to $140/barrel today. This is counterintuitive considering increased oil-driven inflation expectations should correlate to higher yields, lower bond prices. Of course this ignores the equity market selling hysteria we are seeing.
So I responded (paraphrasing myself more eloquently): ‘One of these two markets is wrong. Either bonds fall here, with yields eventually running high to compensate for inflation trending up, or oil collapses signaling the beginning of a deflationary trend. A trade that makes sense is to sell bonds and sell crude here to some spread ratio where volatility and price movement matches.’
I came up with the ratio of 4 ZB (30 year bond futures) short to 1 CL, which represents a ratio of $460K (in bonds) to $140K (in Crude) notional dollars. That’s a 3.28 ratio, and considering an average of historic and implied volatility of crude is approximately 3 to 5 times that of the thirty year, this 3.28 ratio is somewhat accurate. The ballpark figures are IV of 30 year bonds at 10% and crude at 40%. Going short TLT 4-5x vs short 1x USO will do the same job for those not doing this via futures.
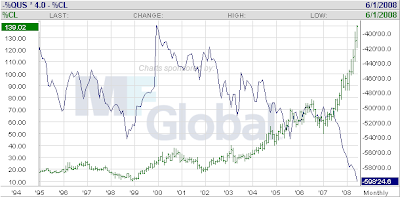
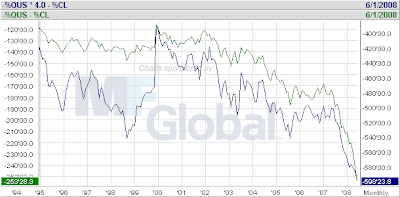
The blue line is the performance of the spread. A reversal in crude or a Volcker-inspired policy track will make this a profitable trade. Until some catalyst, this trade will perform horribly if the broad equities market continues sliding while fear ascends. One could consider adding some S&P shorts or puts to the spread. In the long term I do not believe today’s price action is sustainable. Looking at the chart on a long term historic basis is not useful, as this 4:1 ratio was not correct 5 or 10 years ago, as crude was trading at $15-30 in that time period nor did it pose the inflationary risk it does today. A correct ratio back then might have been 1 crude short to 1 30 year short as displayed in the green line below (for comparative purposes):
More interesting would be an analysis of the performance of this spread in Volcker years. Here of interest is the red line. I dynamically adjust the amount of crude to stay in a fixed 4:1 cash ratio to that of 20 year maturity bond prices(which is similar to the TLT and 30 year bond future). But after this, you see something indicative of irrelevance of the spread (since oil price fell under control). Ignore the 2002-2006 data, as I entered the 30 year yield as a fixed 5.4% (since the source FRB data here does not include the yield since new bonds weren’t floated for that period).
The trick to this trade is figuring out the ratio of 20-30 yr to crude. It should be dynamically adjusted to perform, and could be quite profitable if we do get a repeat of Volcker-like policy looking forward.
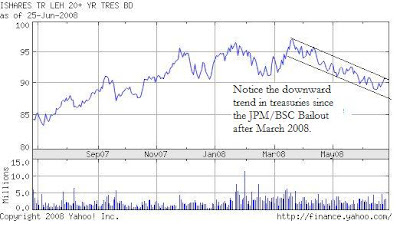
The question is: Which breaks first? If jobs continue faltering, the equity fear trade will continue to support low yields. But to me, treasuries have technically been weak, and to me it seems the worst is past. I’d rather not bet on fear at this point in time (reversing course of my earlier bias towards deep recession with ultralow yields). My hunch is on crude collapsing first (the recession trade). This spread allows you to be wrong if the bid for a technically weak treasuries market does continue to fall. My assertion of treasuries independently:
In conclusion, something has got to break. Either crude is a speculative bubble that will suffer demand destruction from both end users and speculators (as more regulation comes) as they unwind into a recession, and/or central banks eventually react deciding that they want to signal the commodity markets and aggregrate demand downwards by hiking rates (as Fed member Fisher signaled in the most recent FOMC meeting, in agreement with ECB hawk talk). This will force yields to strongly adjust upward while continuing TLT’s (20 yr ETF, which tracks ZB fairly well) downward technical trend.


