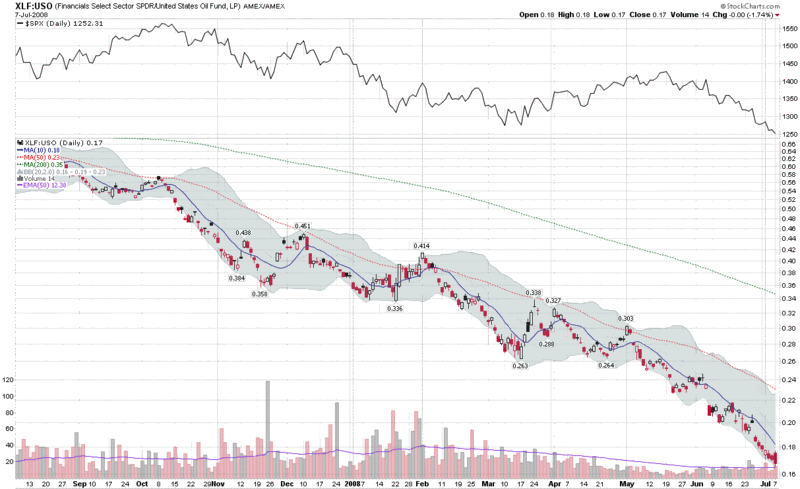
Bill Luby, of VIX & More, on the action of the financials and oil – perhaps another way to visualize a double measure of economic stress. The ratio will go down, for example, if XLF goes down, even if Oil stays the same — i.e., they’ve been moving inversely, but do not necessarily have to move inversely on any given day. – Ilene 
Headwinds Index: Financials (XLF) vs. Oil (USO)
Two numbers have been moving consistently in the wrong direction for the US economy during the past few months: oil prices and bank loan portfolio quality.
The chart below, which reflects a ratio of the valuation of financials (XLF) to crude oil prices (per the USO ETF), neatly captures the recent double threat posed by trends in these two sectors.
You can make an excellent argument that a bottom will not be in until at least one of the two trends, probably both, have reversed. My thinking is that the XLF:USO ratio chart is an excellent tool to monitor those two trends and pinpoint the turnaround. At the very least, I consider the XLF:USO ratio to be a reasonable proxy for two of the major headwinds that the markets are grappling with.


