How low did we go?
We just posted the Big Chart on Friday morning but it's good to have a realistic view of how close we came to the "unrecoverable" 25% line in our indexes. Clearly Asia and Europe have already crossed the point of no return (well, not no return but no return until they get back OVER the 25% line now) yet it is US equities alone that give me reason not to redraw the chart at permanently lower levels.
Clearly our markets have indeed been "the least sucky" place to put equity money this year but we didn't think that losing 25% of our October highs would qualify as "winning" the global market game. Now our equities are suffering as people are liquidating those to run to the relative safety of the advancing dollar, which is 8% off it's July lows.
Let's keep in mind this is the same Big Chart with the same "25% Terror" levels we have been using all year, notice that, rather than the usual "Weeks Move" column, I've put in "Tues Low" so we can get an idea of how close we came and then let's think about our 5% rule, and how a 20% retrace off a 5% level is meaningless, which means any "rally" that doesn't get us back over the "20% Horror" level is nothing to get excited about:
|
|
|
Tues |
25% |
20% |
Feeling |
50 |
|
Index |
Current |
Low |
Terror |
Horror |
Better |
DMA |
| Dow | 11,059 | 10,742 | 10,644 | 11,354 | 11,808 | 11,408 |
| Transports | 2,424 | 2,374 | 2,336 | 2,491 | 2,591 | 2,419 |
| S&P | 1,213 | 1,169 | 1,182 | 1,261 | 1,311 | 1,263 |
| NYSE | 7,793 | 7,502 | 7,790 | 8,310 | 8,642 | 8,304 |
| Nasdaq | 2,207 | 2,142 | 2,146 | 2,289 | 2,380 | 2,321 |
| SOX | 316 | 305 | 419 | 447 | 465 | 349 |
| Russell | 710 | 679 | 642 | 684 | 712 | 715 |
| Hang Seng | 18,300 | 18,019 | 24,000 | 25,600 | 26,624 | 21,424 |
| Nikkei | 11,609 | 11,551 | 13,725 | 14,640 | 15,226 | 12,908 |
| BSE (India) | 13,518 | 13,051 | 15,900 | 16,960 | 17,638 | 14,311 |
| DAX | 5,965 | 5,858 | 6,088 | 6,494 | 6,753 | 6,354 |
| CAC 40 | 4,087 | 4,027 | 4,626 | 4,934 | 5,132 | 4,341 |
| FTSE | 5,083 | 4,961 | 5,066 | 5,403 | 5,619 | 5,402 |
I had said to members last week that the Russell was the one to watch as they had been our leader for quite some time and the RUT puts did make good protection as they fell from 720 to 688 (5.5%) but they came back hard off their lows and we need to watch that inflection point at the 50 DMA very closely, it may be the key to the whole market!
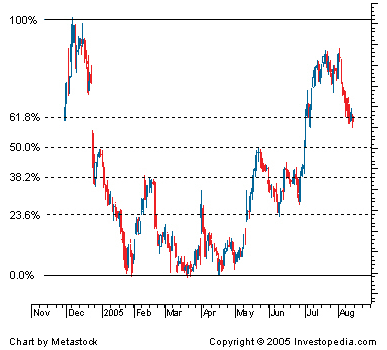
 We need to root for the FTSE to keep it together over in Europe but in Asia, we are already halfway to half of the 25% level on the Hang Seng and that is really terrifying. Fibonacci retracement level run at 23.6%, 38.2%, 50%, 61.8% and then it's bye buy to 100%. The Hang Seng has pulled back 44% at 18,000, hopefully it can hold this level but the Shanghai Composite did not, and is down 63% from it's October highs and looking at possibly testing the 23.6% level – 76.4% off the top at 139 and another 35% down from the current 215 level.
I'm going to add the Shanghai to the Big Chart next time (no time now) and we'll start tracking that saga as well.
So, if our indexes can keep it together above the 25% line then we can keep looking for some sort of recovery but, if we blow those levels and smash through that 61.8% Fibonacci level (down 38.1%) while the rest of the world fails to recover, then this is going to turn into an economic death watch, let's all pray that's not the case…
China led us up in this rally, let's hope that, like oil, they are simply a popping bubble and not our leader to the downside as well.


