Let’s talk about Elliott Waves. This basic outline of Elliott Waves was written by Allan on Oct. 3rd, at which time Allan thought we were a quarter of the way down between B and C. My problem One of my problems with Elliott Wave theory is that the interpretation is highly subjective and the smaller the time-frame (fractals), the more subjective — e.g., sometimes noise is noise and sometimes it’s a wave with a label, and the answer depends on what you want it to be. – Ilene
And now for something completely different

Above pattern is a traditional Elliott Wave pattern. Elliott Waves are fractals, so that this pattern is constant whether on a daily, weekly, 60-minute or 1-minute chart. Assume for the purposes of this example that the above is a general sketch of a weekly DJIA chart, starting in the lower left corner with a Wave 1 that commenced at the bottom of the last bear market, circa 2002. My suggestion is that we are currently just past the "B" which was the High made in the Fall of 2007. Today’s market is about 1/4 of the way from B to C.
 This is basically the same chart as above, only the waves 3 and 4 on the left and waves A and B on the right are subdivided. This chart is important to point out that even if the bigger wave is moving in one direction, the sub-divisions of that bigger wave include contra-trend moves. So for example, even though the movement from A to B on the right is in the UP direction, there was a smaller wave, a to b that was down.
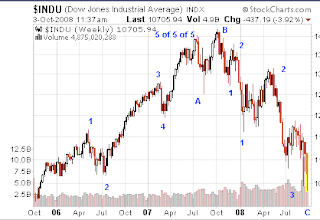
This is my crude hand made DJIA weekly chart showing a completed 5 waves up from the lows on the lower left hand corner of the chart to the multi-year Top in the Fall of 2007, i.e. Wave 5 of 5 of 5. From that Top I’ve labeled Waves A (down) and B (up) and the beginning of Wave C (down, down, down) via a series of waves 1 and 2. Thus my current analysis is that the market is a Wave 3 down. (Wave 3 of 3 of 3, referenced in a previous blog, refers to the internal subdivision within Wave 3). I have no idea if my count is an accurate portrayal of orthodox Elliott, but it does coincide with both my view of the markets and the upper two charts of orthodox Elliott Waves.
This DJIA chart shows the beginning of the drop of wave "C" portrayed in the top two charts. I estimate that the market is about 1/4 of the way from B to C. This also implies that the most powerful part of the drop from B to C still lays ahead of us. C-Wave analysis projects a series of precipitous downward moves in the DJIA, interrupted by sharp but short rallies against the major trend, all of which are followed by steep drops to new lows.
At the end of Wave C, expect one hell of a rally.
A


