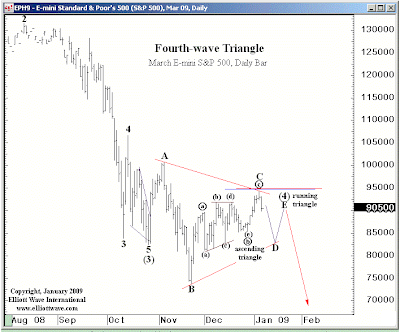
For those following the Elliott Wave situation, here’s an updated S&P chart, courtesy of Mish. Mish also brings into play other technical indictors and indexes. His firm SitkaPacific Capital Management has become market neutral.
S&P 500 Crash Count – Wave Four Triangle
The S&P 500 is in a wave 4. Please see S&P 500 Crash Count if you are new to this discussion. It is the very nature of waves 4’s to morph, and morph it has. Over the past month the preferred count has changed at least 3 times. If you chose to play waves 4’s it is best to be nimble.
Here is yet another interpretation of where we are.
click on chart for sharper image
Chart above is courtesy of Elliott Wave International and Steve Hochberg’s Financial Forecast Short Term Update. Reprinted with permission.
 There are also a number of other valid potential counts that Hochberg and other practioners have outlined. However, what is clear in all of the likely E-Wave counts is that the move up from the November low is a correction. More importantly the move has already satisfied the minimum expected price and time targets for some of the potential counts.
Given that the market looks like it wants to move lower here, it is important to focus on the next downside move at this point. There is always the potential for another swing up in any correction, but time appears to be running out on that idea.
If the above count proves to be the correct count, it would imply that a wave 5 decline is on its way below the November low. Whether or not that is the correct count, it is a valid count that commands respect.
We had a target of 1000 on the S&P and although that could still happen, two days ago we abandoned the idea based on a variety of data, not any explicit wave count per se.
We did not like the volume on the move up, various oscillators, the length of time it was taking to retrace and numerous other confirming factors all of which suggested 1000 was not going to happen.
In non-Ewave terms please consider this chart of DOW.
$INDU Dow Jones Industrial Average
click on chart for sharper image
Since reaching a low in October on almost all daily based technical indicators, we have now reached an overbought position – but price has gone almost nowhere since then. This is typically a very bearish sign.
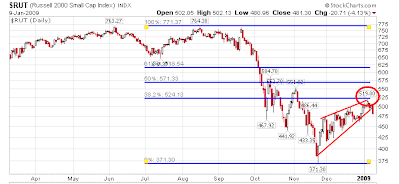
$RUT Russell Daily Chart
click on chart for sharper image
We bailed on net long positions mid day when the Russell tagged that 38% retrace target.
The S&P was still 70 points away from its 38% retrace target at roughly 1008, and all of the other indicators we follow were sporting overbought conditions, something to be very wary of in bear markets.
This shows a need to be focused on number of indicators and indices not just one.
Sitka Pacific Hedged Growth Strategy is back to a market neutral strategy as of two days ago, as is Sitka Pacific Absolute Return. This is a defensive position for us. We reserve the right to change out mind, without notice, at any time.


