Here’s another EW analysis, making it clear that EWers in general believe that the market is approaching a turn from a corrective move up (wave 4) to a final move down (wave 5) to complete an Elliott Wave cycle. Differences between analyses are in the details of current wave 4, with the consensus being that wave 4’s end will result in another significant leg down in the markets.
My Elliott Analysis
Courtesy of Allan

The chart above is our main compass, a Weekly S&P 500 chart that is in the midst of a five wave sequence down from the 2007 highs. There are three clearly designated completed waves and by implication, a Wave 4 that has been sliding and slinking its way sideways to up against the major downtrend. A previously drawn wedge is placed earmarking this 4th Wave with the hope of isolating either an extended Wave 4 by a break upwards out of the wedge, or a completed Wave 4 by a breakdown below the wedge. As is obvious, neither an up or down breakout has yet occurred. By zeroing in on a couple shorter time frames, maybe we can glean some clues as to which way prices are headed.
Daily

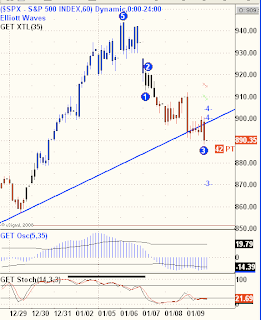
Sixty minute

Whoa, Nellie (not an orthodox Elliott observation), this chart shows a break of that lower trend line clear as a bell.
The phrase means simply "very clear." A bell is used as a model of clarity because the sound of a bell ringing is a clear tone. In the realm of sound, the opposite of clear is dull.
From: The Phrase Finder
The smaller time frame provides a snapshot of all the price action for the first six trading days of the new year. A top of some significance is shown being made on Tuesday, January 6th. Beginning Wednesday and carrying into the close on Friday, prices moved down in what is being shown as a five wave sequence.
This is where my analysis deviates from more traditional Elliott Wave analysts. You may read elsewhere how the Wave 4 is tracing out a triangle or a flat or a double flat or a zig-zag or any number of traditional Elliott Wave corrective patterns. As Mish at Global Economic Trend Analysis notes, there are subtle and changeable ways of analysing short-term charts from an EW perspective, and for trading corrective patterns, being nimble is essential. Sometimes it’s best to take a step back and focus on the bigger picture rather than trying to catch small moves predicted by a perfect EW analysis.
I know that the elusive Wave 5 to new lows will start with a break of that trendline in all of the above charts. That doesn’t mean all breaks of that trendline must result in a Wave 5, only that a break below support will provide the first tangible indication that Wave 4 is over and Wave 5 has begun. If prices correct back above the trendline, my analysis is probably wrong and I am exiting with a small loss. If prices continue lower, I clean up with my short positions.
In fact, if I short every break of that trendline I am certain to enter Wave 5 early enough to profit handsomely, including those small losses incurred, if any, upon those false breaks. Like it or not this is how I trade EW. Keep it simple, with an emphasis on clarity, while being true to the major tenants of the Elliott Wave Principle. It may not be perfect textbook Elliott, but it is profitable. I’ll take profits over perfection, every time.
A


