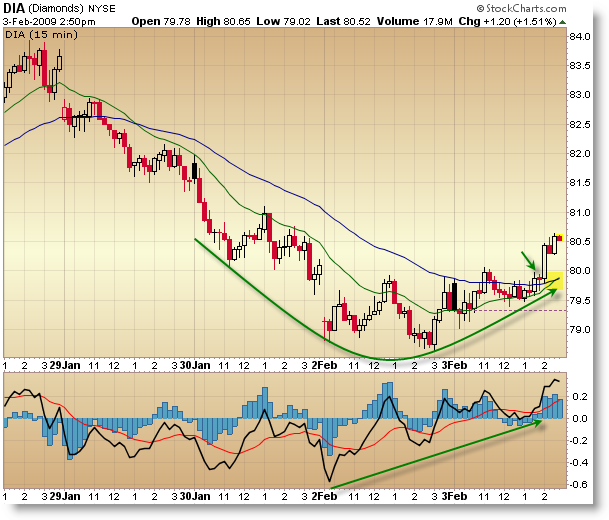
Corey at Afraid to Trade is finding "rounded reversals" in the DIA and in Crude Oil. 
15 minute Rounded Reversal in the DIA
Courtesy of Corey Rosenbloom at Afraid to Trade
I wanted to point out a potentially significant structural change in price that developed today before the close. We have a confirmed Rounded Reversal on the 15-minute chart of the DIA which is setting up confluence support.
DIA 15-min chart:
Rounded Reversals can be significant because they highlight a clean shift in the balance between supply and demand (sellers and buyers). As such, we have a confirmed up-trend in the 15-minute chart after coming off a positive momentum divergence and breaking above support via the 20 and 50 EMAs, which are now crossing bullishly at the time this chart was captured (1 hour prior to Tuesday’s close).
It’s a counter-trend retracement swing, but it’s important to note that the reversal is coming off the 800 index level low in the S&P 500 which is proving to be formidable support (the chart above is that of the DIA – Dow Jones ETF). Any bullish short-term bets are off if we break the current support level, and that of $78.50 in the DIA above, but for now, it appears that the short-term structure has shifted to the upside.
To recap:
Price formed a new low late February 2nd on a large positive momentum divergence
Price has broken above both the 20 and 50 period EMAs
The 20 period EMA is currently crossing above the 50 EMA, setting up the ‘confluence cradle’ trade at $80
Price has completed both a higher high and higher low, officially reversing the 15-min trend.
The 3/10 Momentum Oscillator made a new high along with a new price high, suggesting higher prices are yet to come.
Thus, we have confirmed an official “Rounded Reversal” Trend Change. However, there’s EMA resistance overhead on each of the Daily Charts of the key Indexes, so don’t get too excited yet.
*****
Crude Oil prices, as seen by the $WTIC, have found significant support near $40 per barrel and may be forming a rounded reversal pattern on the daily chart. Let’s see this development.
Crude Oil ($WTIC) Daily:
Remember that $40 per barrel was significant resistance in 2000 and 2003, which was broken in 2004 that set the stage for the powerful rally that took crude near $150 per barrel – giving most Americans gasoline prices greater than $4.00 per gallon.
Crude Oil has fallen significantly from that level and has retested the $40 support level, breaking it gently in late December. Otherwise, price has found support at this level (blue line).
What’s happening now is two things. First, A multi-swing positive momentum divergence has been developing since November which could be showing either building strength in buyers or weakening strength in sellers. Divergences often precede trend reversals but clearly are not 100% accurate.
Second, price itself appears to be forming a “Rounded Reversal” type pattern as price gently heads to new lows and then curves upwards in an arc to complete a gentle, relatively pain-free (no spikes) trend reversal. Price could form a type of mirror-image of the prior decline… but to the upside.
We’ll know this will become the dominant pattern if we break above $50 per barrel any time soon, which would put price above the flat 20 and 50 day EMAs, clearing the EMA resistance. There would be Fibonacci resistance overhead, but let’s focus on the EMAs for now.
Of course, if price broke the December lows beneath $35, we would know this pattern and structure failed. It’s good to know exact price points that will prove your analysis right or wrong, which allows you to set targets, entries, and stop-losses.
Whether or not we do find a reversal here, the risk-reward is clearly skewed to the buyers, making it the cleaner position. If you enter here ($40), your stop would need to be beneath $35 but your target could be upwards of $50, $60 or greater depending on your conviction and how far price does travel if it reverses (of course, use different numbers depending on the ETF you trade, be it USO or a leveraged fund).
Use your own analysis and see if you find additional insights in the price data itself (perhaps with other indicators, etc).


