Mega-bearish action in the chart-reading world according to Allan.
Thursday Mid-Day Charts Update
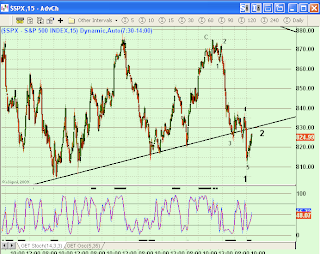
[This first chart is a 15 minute interval chart of the SPX. – Ilene]

Not a lot of time to comment here, but these two charts represent the price action so far today, Thursday. The most bearish interpretation is on the chart directly above, which suggests a 3rd Wave hard down is coming as soon as this small rally up from today’s lows is over. Note how prices dropped below wedge support on the Open and have worked back up toward the bottom of the wedge in the past few hours.

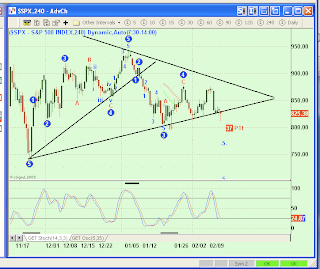
Above is a zoom out of the wedge chart [240 minute interval chart]. Prices gapped down out of the wedge and have rallied back up to test the bottom support line, now working as resistance. To simplify things, if prices work their way back into the wedge pattern, Bullish. If prices reverse lower, bouncing down off of the wedge pattern, Mega-Bearish.


