Tyler Durden at Zero Hedge explains the factors he evaluates when attempting to identify a market bottom.
Timing The Market Bottom
A common query among most equity market participants is when is it time to buy. Timing a market bottom is usually a very dangerous play and it traditionally makes sense in the context of cost averaging down (assuming one doesn’t make a 20% return overnight), and of a significant liquidity backstop. In other words neither we, nor any responsible financial advisor, will ever recommend betting even half the farm on a hunch, based on technicals, fundamentals, tea leaves, kaballah or other sound investing methods.
The current market environment is unique in that since essentially the entire non-financial equity world trades as one asset class, on huge momentum swings, and with the mania of an overcaffeinated daytrader, i.e. with a lot of embedded risk, one could flip the argument and claim the reward should be commensurate.
This leads to the question of what are the key criteria that analysts, pundits and talking heads look at when the make bold market bottom claims. We present a list of conditions, which while not exhaustive, provide a good framework to analyze whether conditions are ripe for a substantial move up (or down).
1. Is forward looking data bottoming?
The equity market tends to bottom when the deterioration in the labor market and economic growth are at their worst. The S&P historically bottoms near a time when new unemployment claims are at their highest levels. Another major metric followed by forward-watchers is the reading on the ISM (Institute for Supply Management), or the manufacturing index, which measures manufacturing activity. Again based on historical data, the S&P has usually bottomed one or two months before an ISM inflexion. As the chart below demonstrates out of 8 economic cycles, the only time this did not occur was in 2001, after an ISM low of 40.8 was hit in October with the market proceeding to sell off for another 15 months. It is arguable that the post 2001 bubble was an aberration resulting from the double whammy of the still lingering Internet bubble and the "one-time" event of September 11.
For the current cycle, the ISM hit a 28 year low of 32.9 in December and staged a modest rebound to 34.9 in January, which would imply based on empirical data the S&P bottomed in November. It is important to remember that the absolute value of the ISM is not so much the determinant here as its derivative, i.e. the bottoming out. A March ISM reading higher than 34.9 by even 1 point would likely incite a substantial market rally. Then again the ISM reading is so low that it is debatable how valid its indicative power is at these significantly depressed levels. And we would strongly caution a singular focus on ISM as employment numbers keep deteriorating, and we believe that metric is substantially more relevant from a forward looking perspective. The combination of a flattening in both ISM and new unemployment claims would undoubtedly cause a significant market rip.
 When we wrote about the Russia, Eastern Europe and Korea recently, we were focusing on their capital market deterioration. However, it is only a matter of time before that weakness spreads to the overall economy (and neighboring countries). While recent foreign business surveys have shown improvement along some metrics, the overall foreign data are conflicted, with recent deterioration being observed among global trade routes, most notably in Asia. There is also a second issue: investors may have be overoptimistic for a rebound in EMs: the YTD Brazil index is up 8% while China A-shares are up 24%, thereby pricing the "good" side of the news. The inflexion point of the business cycle will inevitably present good and bad data, although care has to be taken to analyze the potential risk of the credit crisis’ spread catching up with more important lagging indicators.
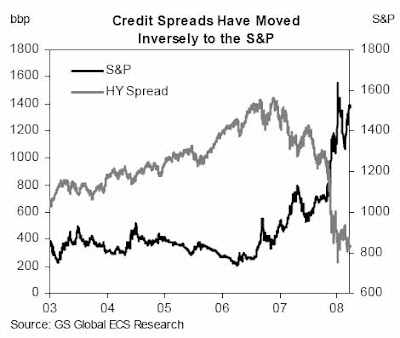
Empirical data shows a very close inverse correlation between the S&P and the spread on the HY index. While spreads have tightened over the past 3 months, a lot of this has to do with the pricing in of the recently announced Finance Stability Plan [FSP], which at this point may only lead to further disappointment. For a sustainable rally, credit spreads, especially for high yield names, have to collapse by a substantial amount which will likely be contingent on many of the postulates of the FSP kicking in. Other credit improvements such as a decline in write downs would be a welcome metric. Of course, to keep things confusing, January was one of the best month in history from a new Investment Grade debt issuance stand point.
4. Is the Finance Stability Plan effective?

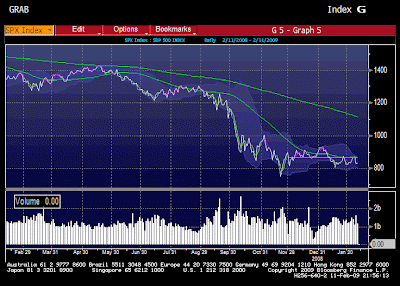
The preliminary assumption that the S&P 500 may have bottomed in November has so far been consistent with technical analysis – the market has been trading in a very tight range in the 775-850. This article will not delve into the technical aspects save to say, that the current level on the S&P may be priced surprisingly well given all the above 5 criteria. Investors should compare improvement versus deterioration in all five to determine what the impact will be over the coming several months.


