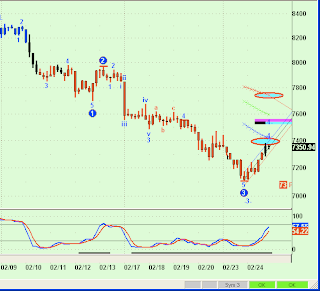
Here’s the latest chart analyses, from most recent (intraday, today) through lastnight. Charts are predicting a rally and a failure.
Wednesday intraday update
Yet another Wave 5
These charts are screaming, "Yes we can," to another Wave 5 decline at the doorstep. Here are my charts, which should be read in light of the Volatility Cycles [below] post.
This first chart is a 60-minute DJI chart showing a uptrend channel containing prices of a Wave 4 with potential targets just above current prices:
This next chart reveals ultimate lows as forecast by my software:

Finally, some internal indicators suggesting either Wave 4 is about complete as of Tuesday’s close, or possibly after one more big up day to the upper Wave 4 target:
Volatility Cycles
Below is my Sixty-minute Trend and Elliott charts on the VIX:

One characteristic of market volatility is that stock prices usually move opposite volatility. When stock prices rally, volatility drops, when stock prices fall, volatility rises. Forecast one, forecast both. The EW chart shows the VIX completing five waves up yesterday and today, what appears to be an "A" wave down. This should be followed by a "B" wave back up near the the prior Fifth Wave high. The suggestion is that stock prices will now fall while VIX rises in a "B" Wave.
Any help from the left side, the Trend chart? Sure. Every sharp drop in volatility (like today) is usually followed by a sharp rise in volatility (tomorrow?).
Here is a Cycles chart on VIX:

Today’s drop in VIX coincides with a cycle low. The chart is forecasting that VIX will now rise into March 3rd, suggesting the inverse for equity prices, a drop into March 3rd. This is exactly what the EW and Trend analysis charts are forecasting, i.e. a rise in VIX and a fall in stock prices.
Below is a new Cycles chart on SPY, the S&P 500 ETF:

The above Cycles chart of SPY is showing both a small blip up which would account for today’s action, and then lower into the first few days of March, thus confirming the VIX analysis.


