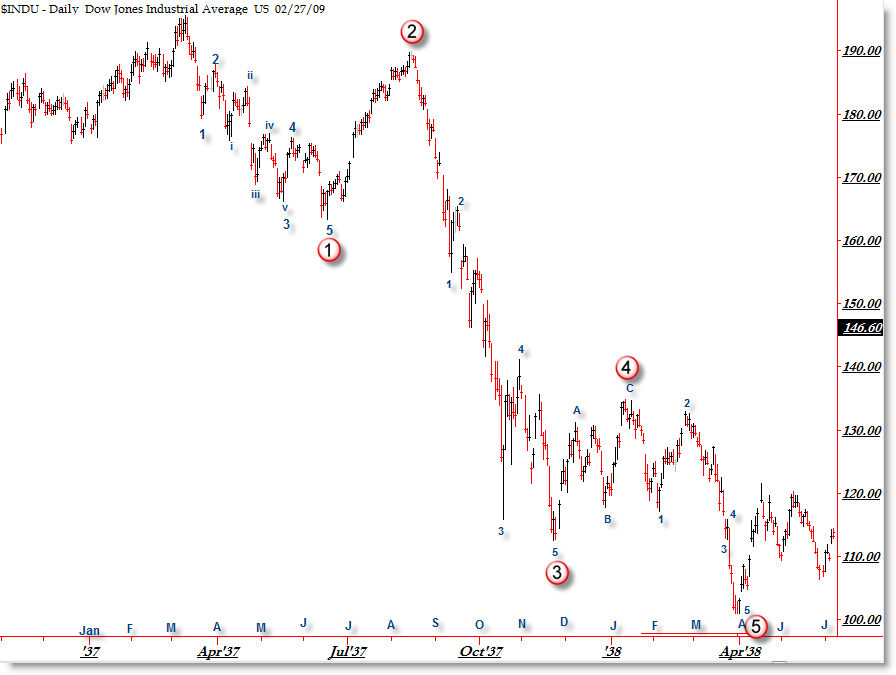
Here’s Corey’s update on the market: the current Elliott Wave pattern is very similar to that made by the Dow in early 1937 through April 1938. Charts suggest more downside, as the end may be nearing.
Amazing Similarities in Dow Jones 1937 and Today
Courtesy of Corey Rosenbloom at Afraid to Trade.com
In charting, sometimes past is prologue. There is a distinctly eerie similarity in the 5-Wave decline from the October 2007 highs today with what happened – almost identically – as the Dow peaked in early 1937 and bottomed out in April 1938. It’s something you probably should examine, as it could resolve the same way today as it did then.
Dow Jones Index Daily from 1937-1938 with Elliott Wave:
Reference the prior blog post: “Full Scale Wave Count on the S&P 500” which included this chart:
Looking at the charts side-by-side shows a chilling reflection of similar Wave structure progression that unfolded.
The structures contain the expected progression of 5-waves which properly subdivide into corresponding fractal waves as the big picture develops as the bear market progresses.
Keep in mind, there were no computers in 1937, no online brokerage accounts, no hedge funds, etc. What’s stayed the same – arguably – is human psychology as investors’ fear and greed interact to create these patterns. Also, Mr. Ralph Elliott almost certainly saw this 5-wave decline develop in the Dow during his time which perhaps was further confirmation of his “Wave Principle” he was developing at the time.
In the case of 1938, the circled 5 wave was the bottom (at 100) at that time before an ABC corrective rally launched. If past is prologue, then we have yet to complete the final circled Wave 5 to complete the pattern, though we’re much closer now than we were.
What exactly happened after I cut-off the chart in 1938? Stay tuned for an update!
Matchbox Twenty – How Far We’ve Come


