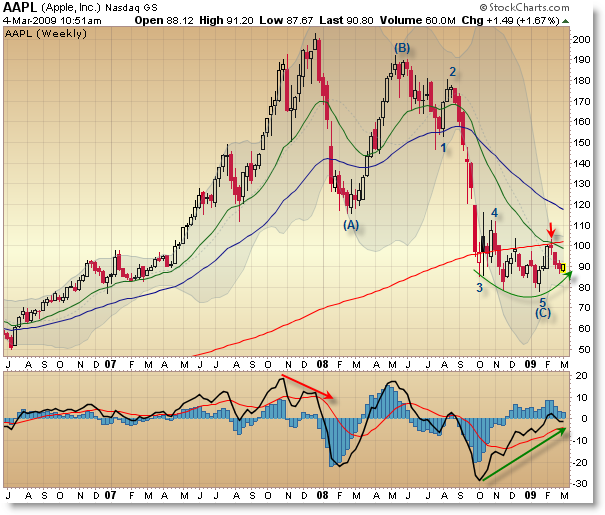
Apple Inc (AAPL) has been holding its own throughout the recent market downswing from February, showing relative strength to the S&P 500. Let’s look at Apple’s Weekly Structure (using basic Elliott Wave) and also a key support level on its Daily Chart.
Apple (AAPL) Weekly:
Apple is likely coming off an ABC Corrective Three-Wave phase into support about the $80 level. The final 5th wave seems “iffy” but we’ll have to watch its development closely.
There’s a lengthy positive momentum divergence that has set in since October, which could have bullish implications if price can stabilize at this level, and moreso if Apple can break above $100 per share (which would reverse the short-term trend to up).
However, at the moment, price is beneath all three key moving averages, which shows structural weakness. Aggressive traders might decide to enter here (as a tight stop can be placed beneath $80 or $85) but more conservative traders probably want to wait until Apple shows strength and confirms potential support at these levels.
Apple (AAPL) Daily:
Dropping down to the Daily chart shows us what it’s like “Inside the Divergence” that has been building. Price has formed a tight coil or rectangle between $85 and $105 (technically $80 and $110) which has accounted for the positive indicator divergence.
The obvious price points to watch short-term are the $100 level (which is round-number resistance and the confluence of the 20 and 200 moving averages on the weekly chart) and $85 (which is multi-tested support).
It would appear that price could be more likely to challenge and break above $100, though if price broke beneath $85… and especially $80, then any bullish argument would come quickly into doubt. A break above $100 could lead to a price expansion move up to the $130 level or beyond… but it’s probably best to wait for confirmation before taking a position within a market in balance (or price consolidation) as it’s always uncertain in which direction the break will occur.


