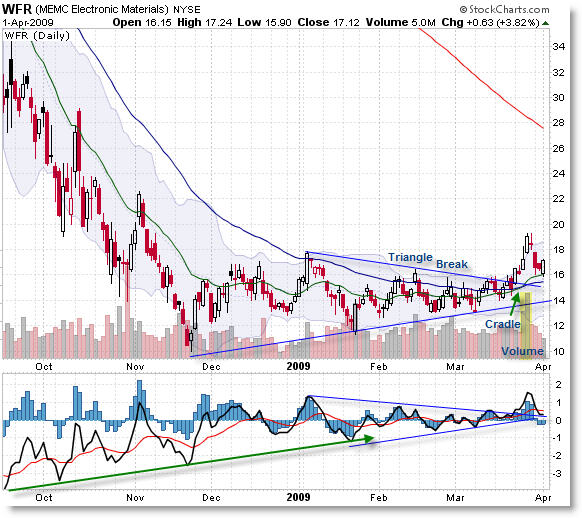
Corey describes a bullish reversal pattern in WFR’s chart – cradle set up, multi-swing positive momentum divergence, and price break out – all good. But see Phil’s recent post for a contrarian view. – Ilene
Bullish Reversal Patterns in WFR
Courtesy of Corey Rosenbloom at Afraid to Trade
MEMC Electronic Materials (WFR) is forming a rather bullish reversal pattern that can serve as an educational example of how a Rounded Reversal forms, how the “Cradle” sets up, and how a multi-swing positive momentum divergence forms. Let’s see them.
A higher timeframe chart will show WFR resembles Crude Oil (and USO) in terms of its decline and then multi-swing positive momentum divergence that began back in October 2008. One divergence can be a signal that the next retracement might be larger than expected – a multi-swing divergence can frequently precede a trend reversal.
A consolidation triangle formed all through 2009, and price has broken strongly to the upside out of the triangle on a volume surge last week. Momentum (3/10 Oscillator) also broke out of its own triangle consolidation, hinting that higher prices are yet to come.
After the divergences and triangle formed, the recent price action in March allowed price to break out gently above the 20 and 50 day EMAs, and eventually the “Cradle Trade” (my favorite) formed which occurs when the 20 EMA crosses above the 50 EMA at a specific point, and price comes back down to test that point. The Cradle is great because it often precedes trend reversals and if the reversal fails to materialize, you can place a tight stop beneath the confluence level and so your risk is low to ‘find out if the cradle will hold.’
I really wanted to show this chart for educational purposes, as it shows a good example of the following concepts:
Multi-Swing Positive Momentum Divergence
Triangle Consolidation (and break-out on high volume)
“Rounded Reversal” (in price)
Cradle Trade
See if you can find additional lessons in WFR’s price structure.
Corey Rosenbloom
Afraid to Trade.com


