Courtesy of Corey Rosenbloom at Afraid to Trade.
A Quick Look at Key Financial Stocks BAC, C, WFC, GS
With all eyes being focused on the Financial Sector, I thought it would be helpful to key-in on four key financial stocks and look at their daily chart: Bank of America (BAC), Citigroup (C), Wells Fargo (WFC), and Goldman Sachs (GS). Let’s hit the high-points on each one.
Bank of America (BAC):
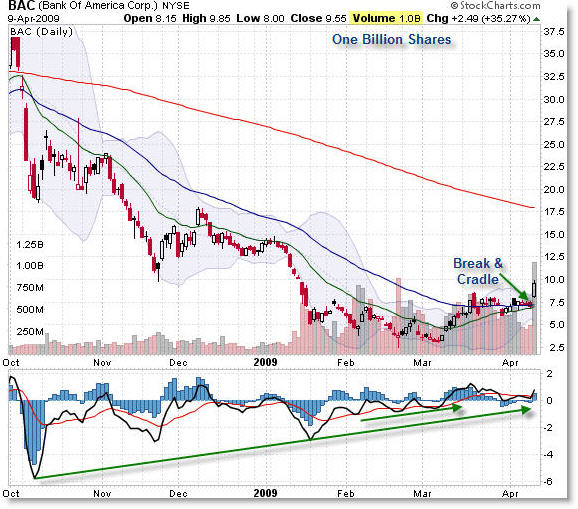
Bank of America was taken down sharply to the $2.50 level, though a multi-swing positive momentum divergence preceded the recent strength, which has resulted in price quadrupling in over a month’s time as price has broken above the daily 20 and 50 EMA, and now a Cradle Support trade just triggered as the EMAs themselves crossed bullishly. We should expect these to hold as support.
The pathway to higher prices potentially is upon us, as we have ‘open air’ above – prior swing highs could form resistance, but the EMAs should be expected now to hold as support.
Notice that over 1 billion shares traded on Thursday’s strong trend day – BAC gained 35% in one day alone!
Citigroup (C):
Citigroup’s stock is not as strong technically (chart-based) as Bank of America or the other large financial stocks (that remain). Price rose 12.50% on Thursday, though we are currently trapped beneath the 20 EMA as support and 50 EMA as resistance – that’s not a compelling place to be.
Look closely and you’ll see a negative volume divergence setting in as price rose off the $1.00 lows of March. That’s a little concerning to the bulls. However, price has tripled off the lows which isn’t shabby.
Strange to know that for some of your monthly banking fees or even ATM charges, you could be buying a share of some of these lower-priced mammoth financial companies….
Wells Fargo (WFC):
Wells-Fargo fared better than some other companies (BAC and C in particular), and we see a current bullish breakout from a triangle consolidation on stunning volume. WFC was the “talk of the town” on Thursday thanks to better-than-expected earnings. Thursday’s action broke a declining trend in Volume, and as long as support holds at $16… and the gap does not prove to be an exhaustion gap (it could very well be a ‘breakaway gap), then a test of $24 or beyond is not out of the question.
Goldman Sachs (GS):
Finally, Goldman Sachs has survived the financial crisis better than many major financial institutions, and its stock now trades above $100 per share again. While you may consider Goldman ‘pricey’ relative to other financial companies, realize that you often get what you pay for, and that stocks are priced high for a reason… and low for a reason.
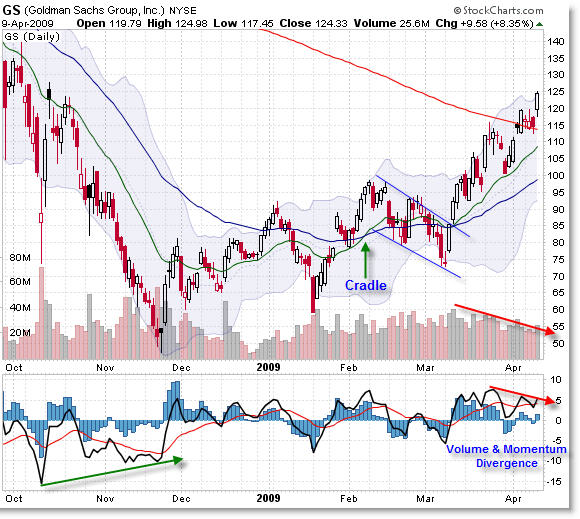
Goldman has been a leader of the Financial Sector – note that the low so far was made in November 2008 (while many other companies made lower lows in January and March) which means that GS is showing relative strength to them all (who made new lows).
A Cradle Cross-over formed in early February (which often is a precursor to a trend reversal) and indeed we did get a trend reversal back to the upside on the Daily chart. Price recently completed a Bull Flag formation into the March (higher) lows and we’ve just broken above the 200 day SMA.![]()
The two things that worry me – which bulls might manage to shake-off – are the negative volume and momentum divergence that has set-up since late March. Otherwise, it seems all cylinders are firing.
Look deeper into these and other financial stocks, for as many have said, we can’t have a meaningful market bottom without a definitive bottom and strength in financial stocks.


