So, what pattern is the S&P 500 forming right now? There’s three main possibilities using classic technical analysis at the moment – let’s take a quick look at these three possibile patterns and what they might mean.
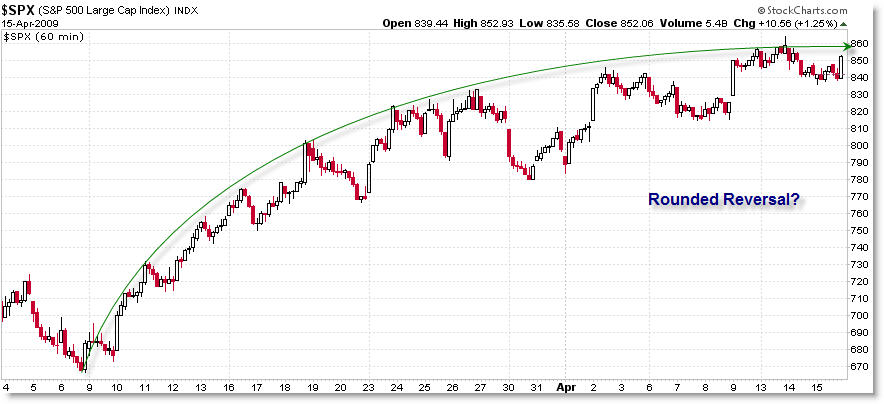
First, it could be a standard “Rounded Reversal”:

(Click on any of these charts for a full-size image)
I think this pattern would be the most fun to watch resolve, in that Rounded Reversals reflect orderly transfer in Supply and Demand (Sellers and Buyers), which implies that we’ll see a mirror image decline as we saw of the rally – if only it were that simple.
The Rounded Reversal pattern takes into consideration the most data points beginning from the early March lows, and I deem it to be the dominant pattern at the moment until proven otherwise. We could still see a slight push up to new highs but if this is the correct pattern, I would not expect us to go beyond 870 to put in a short-term top.
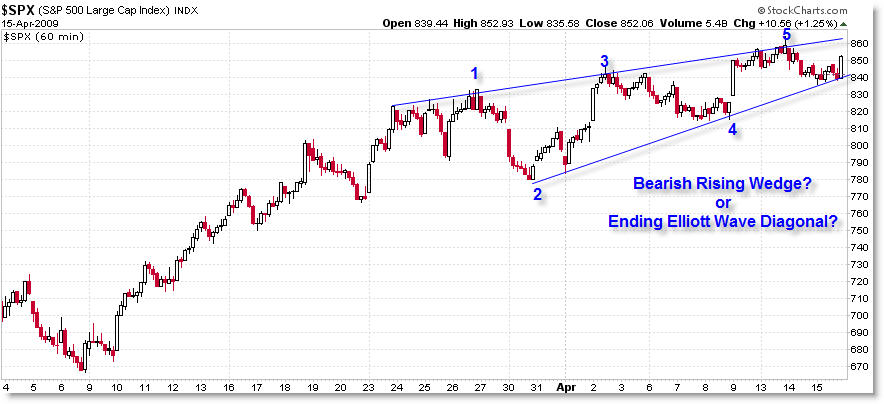
Many people believe we’re forming a Bearish Rising Wedge (or also an Elliott Wave Ending Diagonal):
This is the pattern I discussed earlier in the week. Luckily, I was correct in forecasting and trading a downswing to the bottom of the rising trend channel, and we found key support at that line as expected. If this is the dominant pattern, it has a little more ‘room to run’ inside the pattern, as we would expect price to remain contained within these converging trendlines.
The expectation is for a sharp bearish break (eventually), though the pattern would be invalidated by a clean break-out above the 870 level.
Elliott Wave purists are discounting this pattern as an Elliott Pattern because the labeled 3rd wave is larger than the 1st wave and wave 5 counts out as a 5-wave advance – neither of which ‘fit the bill’ for an ending diagonal in Elliott guidelines. It may just be a plain vanilla wedge instead of an orderly ending diagonal (in Elliott terms).
Or maybe it’s as simple as a Rising Trend Channel:
This would be the easiest pattern – other than the Rounded Reversal – for most people to see and perhaps react. Trendlines should touch (connect) as many points as possible, and this means sometimes that you’ll have to account for false-breaks (as which occurred in late March) to pick up more ‘touches.’
The more times a line is touched, the more valid it is, but of course no trendline holds forever.
While the Rising Wedge has a bearish expectation, the Parallel Trendline pattern has a neutral expectation – all we would expect would be a break-out of the ‘rising rectangle’ which should lead to a price expansion move once a clean break is signaled – it could occur in either direction according to basic technical analysis.
Conclusion:
Take a closer look for yourself as to which pattern you feel is most likely. It may not even be a pattern I have listed here – you may be thinking something totally different.
Hopefully, it won’t be much longer before we all find out and trade accordingly!
Feel free to share your thoughts on the dominant structure or price pattern you see developing.


