Update on the technicals of the S&P, courtesy of Corey Rosenbloom at Afraid to Trade.
Three Push and Wedge on SP 500
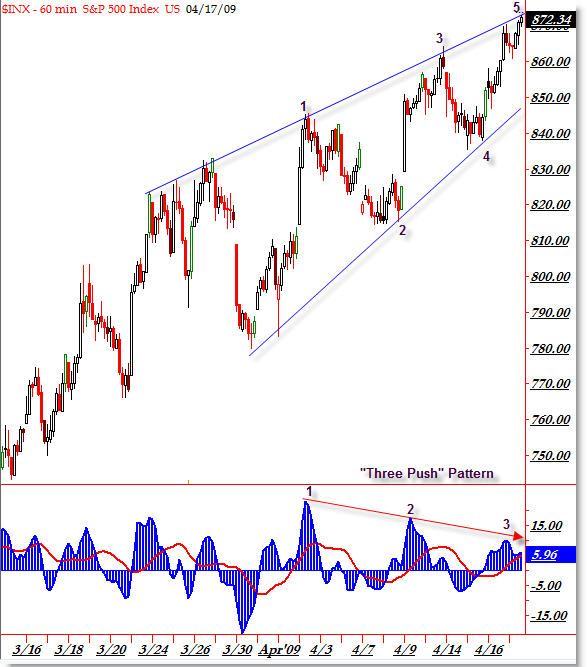
A new structure has developed, which is known as the “Three Push Pattern” as price continues to ‘wedge’ itself into a rising consolidation. Let’s see the current S&P 500 structure mid-day on the 60min chart.

Price has now rallied to the peak of the converging trendlines that are forming a possible bearish rising wedge, which places it at a “make or break” price point we all need to watch very closely.
I wanted to get this post out quickly to show the developing structure, which has now formed a “Three Push” Reversal Pattern. Notice the three new price highs that formed on a triple-swing negative momentum divergence in the 3/10 Oscillator.
The expected play at a minimum is for a retest of the rising trendline around 850, but aggressive traders might want to hold on for a larger target should price weasel its way out of the wedge formation, which would be quite bearish. Should price continue to rally and break outside the wedge, the stop-loss point would be clearly defined.
Do your own analysis and see what else you might be able to glean from the current price structure.


