Here’s an interesting discussion by Benign Brodwicz with charts on income inequality and the implications to society. – Ilene
Debt and income inequality (with additions 4/30)
Courtesy of Benign Brodwicz at The Animal Spirits Page
Observations:
- Note the similarity between the graphs of income inequality and debt/GDP.
- It took a war, not just a depression asset price collapse reducing wealth inequality, to reduce income inequality last time, supporting the hypothesis that a new social contract is required to cure this ill. The war brought people more income equality, the New Deal didn’t. Without the motivation to band together to fight a common enemy like the Nazis, will Americans tolerate deficits of 13 percent of GDP and inevitable tax increases, when there is no equalization of the income distribution and the highly compensated continue to receive outsized rewards? This is the great risk to the social fabric, and why I think the social contract is [widely perceived to be, which is the same thing as being] broken.
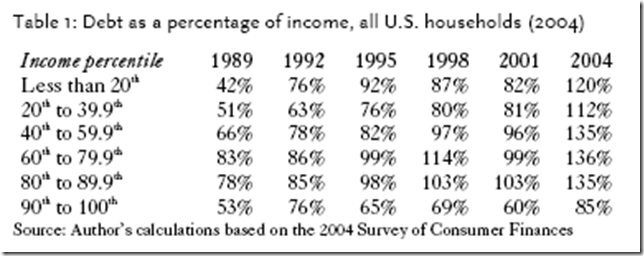
- All households took on more debt in the national run-up since 1980, but lower income households took on much more in a attempt to “keep up” with higher income groups. Median household income stagnated relative to mean income during this period (U.S. Census Bureau). The bottom half is deleveraging, implying that their standards of living will fall further behind the top income classes, implying further rending of the social fabric.
- Fixing the banks won’t fix this; in fact, it will exacerbate the current quasi-feudal situation.
Source: Emmanual Saez’ home page. The income measure is personal tax return based, so is roughly based on household income.
Source: Credit Suisse
Source: Boston Fed


