
Courtesy of Bill Luby at VIX & More
VIX:VXV Ratio Moving Toward Bearish Zone
Lately I have received quite a few requests to talk about the VIX:VXV ratio, something that I first blogged about back in December 2007, shortly after the VXV volatility index was launched.
The chart below is my standard VIX:VXV ratio chart and uses the 1.08 and 0.92 end of day closing levels as basic long and short signals. The last signal on the chart is a March 1st long signal that preceded the March bottom by a week. On April 19th the VIX:VXV ratio closed at .9276, but was below the 0.92 signal line on an intraday basis.
Yesterday, I saw some data that showed the VIX:VXV ratio below 0.92 during the trading session, but a review of the intraday chart tells me that while the VIX:VXV ratio was in the 0.9150 to 0.9200 area from about 9:50 a.m. to 10:10 p.m. ET, any lower numbers were likely to have been the result of bad prints.
For the record, while yesterday’s 0.944 close suggests a bearish bias, my reading of the ratio is that the preferred entry point for shorts positions would require waiting for a close of 0.92 or below.
[Note that while this basic interpretation of the VIX:VXV ratio sets parameters for long and short entries, it does not include recommendations about exits or how to incorporate the VIX:VXV ratio into a trading system.]
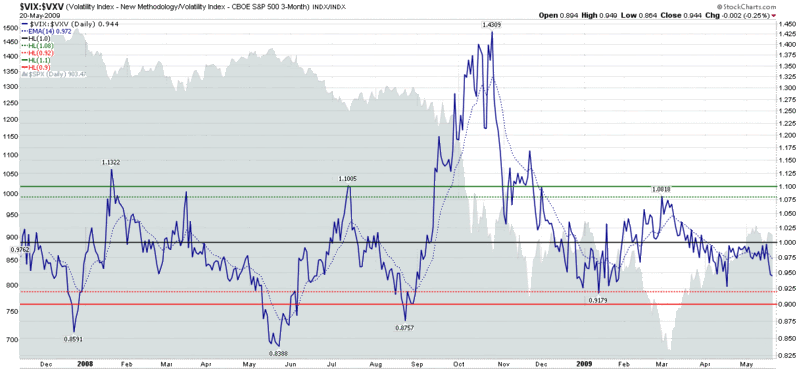
[source: StockCharts]
Disclosure: Long VIX at time of writing.