Bulls Can’t Seem to Break 950 on the SP500
Courtesy of Corey at Afraid to Trade
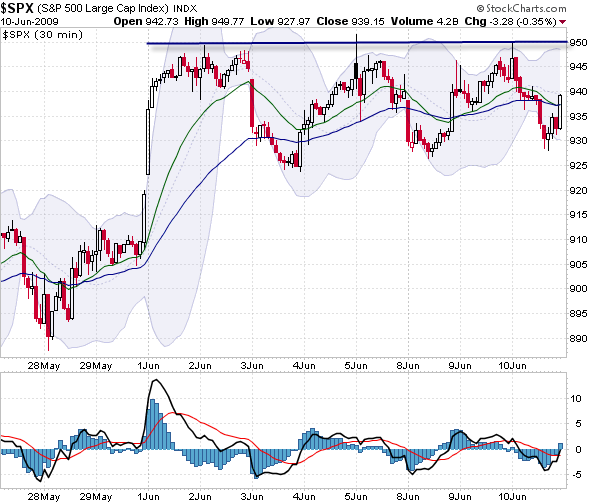
I mentioned earlier in my post “So This is What Resistance Looks Like” where I noted that 950 was becoming increasingly difficult for the bulls to clear – they still haven’t cleared that level. Let’s step inside the 30 min chart on the S&P 500 to see the recent price action and current structure.

Though we flirted intraday on the open of June 5th, price hasn’t breached the 950 level – in fact, I’m surprised at how tight a level price has coiled in the 950 to 930 zone.
Until we break one way or the other out of this range, the price structure and trading tactics are clear – play long and short within the range once price hits an extreme in the range.
You might even want to avoid swing trading in this environment until we do get a price break, which would be expected to result in a trend (or momentum) move.
The 3/10 Oscillator is becoming useless in a flat momentum environment – so are the 20 and 50 EMAs on this timeframe.
Remember, during flat market conditions (triangles, ranges) oscillators (like the RSI or Stochastic, etc) become of value in highlighting possible overbought/oversold conditions to initiate trades.
Look closer and follow the price – do you really need an oscillator to show you overbought and oversold conditions in a clean consolidation as we’re having now?
So until we break above 950 or beneath 930, continue to watch the structure closely and lower your expectations.
Corey Rosenbloom, CMT
Afraid to Trade.com


