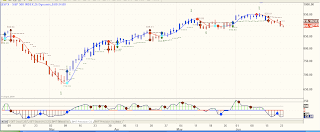
Trading signals summary, courtesy of Allan
One day the bottom will drop out

The above chart [click on chart to enlarge] represents a Daily chart of the past six months of the SPX as seen through the eyes of Blue Wave Trend Model, Advanced GET and the Blue Wave Precision CCI Oscillator (bottom panel).
Note how the price bars changed from mostly red to mostly blue around the first week of March. At about the same time, Advanced GET detected a new 5-wave sequence up. Also around then, the CCI Oscillator went from well below it’s zero line to well above it’s zero line.
Add it all up and what we had was a down trend flipping to an up trend and in the past few days, apparently flipping again to a down trend. This is not a perfect system, but it is several degrees better then guessing.
Not shown are other indicators and trend lines that add to the information gleaned from the chart. Information that is essential in recognizing and navigating through market trends.


