Click here for a FREE, 90-day trail subscription to our PSW Report!
Basic Trading 101
 Courtesy of Allan
Yet every so often a communication from one you impacts me with frustration and dismay. By now I would think that if you have been with me for six months, or a year, or longer, you would be making money trading, using some ideas and techniques that I have described over the months and years of writing AllAllan. But I hear something else from these communications, I hear that many of you are not getting it.
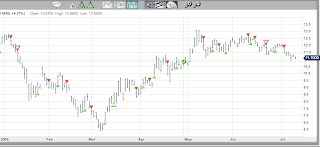
Today I am going to present to you three ways to trade using the simplest of strategies based on end of day prices and a minimal of necessary hardware or software. I am going to use an unleveraged ETF and remove all of my more sophisticated (read: expensive) tools, using only Market Club Triangles and 3 Line Break Point charts, both very similar in their construction and entirely objective in their application.
You can trade this going forward on XLF and probably not need anything else to be successful month to month, quarter to quarter and year to year. But it is my hope you will instead, glean from this the very basic premise of a simple rule-based system that can be applied and tweaked to any number of tradables, a simple trend following trading system from which anything is possible if you only have the discipline and desire to make it work.

Their are actually two systems shown on the chart:
(1) Enter trades on appearance of WEEKLY TRIANGLES and exit on appearance of reversing DAILY TRIANGLES. If flat, RE-ENTER on appearance of DAILY TRIANGLE in direction of most recent WEEKLY TRIANGLE;
(2) ENTER/EXIT on appearance of WEEKLY TRIANGLES (disregard DAILY TRIANGLES).
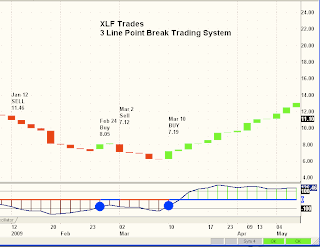
The third system is based on the 3 Line Point Break chart and nothing else.
Here is the chart:
This strategy is simply to ENTER LONG OR SHORT in concert with 3 Line Point Break Chart. I’ve annotated the four trades, year-to-date, on the above chart.
All of the signals generated on the three trading systems are summarized and analyzed in the table below:
I am well aware of the shortcomings inherent in such a small sample size, so feel free to spend hours back testing these over the course of decades, if that is what it takes to build some confidence in these matters. This is what the market and the XLF is doing NOW and it is working NOW.
That’s it. Your introduction to successful trading in it’s rawest form. Scoff at it’s simplicity, but if you find anything that works as well and that doesn’t cost and arm and a leg or is knee deep in esoteric bullshit interpretations and/or indicators, bring it on. We’ll make that our advanced course, Basic Trading 102.


