What does a double dip recession look like?
Courtesy of Edward Harrison at Credit Writedowns
On Friday, in reporting on second quarter GDP statistics, I wrote with some skepticism about the underlying consumer demand which would underpin a sustainable recovery. I do feel that the stage is set for recovery; Alan Greenspan thinks the economy has already recovered. However, I am worried that a double dip could result as much of the likely output gains will come from changes in inventory destocking and not from consumer demand.
Then again, why do I think there will be any recovery at all? An astute reader asked me “how could that be possible when, as you document well, this is a technical recovery, and there’s no sign of consumer recovery? It seems more likely that this will continue to last for the foreseeable future.” That is a very good question which I hope to answer here with some words about what recession is, about the ‘new normal’, and about GDP being a first derivative statistic. Then I will finish up with a look back at the 1980-82 double dip to show you how the 1980-82 double dip looked statistically and why it could presage what we are about to experience.
What is recession?
In a nutshell, a recession is a period of diminishing economic activity. That’s it, plain and simple. Now, the NBER, which decides the official dates of recession in the U.S., looks at five areas to decide when a recession begins and ends: output (real GDP), production, sales (wholesale and retail), employment and real income. When those areas show a general decline, the economy is in recession. When those statistics start increasing, the recession has ended. In a post last month “Technical recovery won’t feel like a recovery to most,” I said:
The NBER is looking to date the period when economic activity is diminishing, not when it is diminished. That means that economic activity MUST be LOWER when an economy ends recession and starts a recovery than when it entered the recession. Recovery starts from a position of diminished economic activity. I attempted to get this point across in detail in my post “Economic recovery and the perverse math of GDP reporting.”
Read those two referenced posts. They make fairly clear that we are talking about falling output, falling sales, falling employment during a recession. When the fall ends, the recession is over.
The New Normal
A lot of pundits have been looking to that period when the recession is, indeed, over. They are talking about the New Normal which is likely to result after this downturn. Some like Bill Gross believe recovery growth rates will be much lower going forward. We’re talking 1-2% here, not 3%+ like we are used to. Others are talking about a new normal of savings and lower consumption. My take on the new normal is that it represents a new baseline from which to start.
The US economy was pumped up artificially due to excessive leverage and artificial consumption. The GDP statistics of the last decade reflect this. The level of output in late 2007 is not likely to achieved again for a very long time. After a 2-year period of falling output, the worst plunge in at least half a century, we will reach a new lower baseline level, the new normal. We will then start again from that new diminished economic plateau.
GDP is reported as a first derivative number
When will we reach that lower plateau. In my view, that period is almost upon us. Manufacturing statistics show a level just below 50, the demarcation between expansion and recession. Real GDP is likely to rise in Q3. Retail sales are now rising. Personal income is flat to rising. And jobless claims have come down substantially. All of this says that we are fast approaching a flatline where the economy stops falling.
Moreover, pro-cyclical effects like the inventory cycle are likely to give an extra shot in the arm to the economy, reinforcing this dynamic. Add in fiscal stimulus which is due to come online now and a recovery is likely by late this year or early next year.
Remember, GDP as reported is a measure in the change in output. So, once we reach a level of output that is sustainable only over the medium-term (say 6-18 months), recovery is likely to take hold. For example, even if the underlying consumption growth is slightly negative, government spending and inventory adjustments can and will offset this long enough for employment gains to begin, boosting income and spending enough for recovery to take hold. Recovery can come even if consumer demand remains weak.
But what about a double dip?
So what happens if demand remains weak over the longer term as consumers repair their balance sheets? Isn’t the new normal in part about increased savings and lower consumption? In that case, the excess capacity in the system remains – and right now it is at all time lows below 70% . And when there is excess capacity, people lose their jobs, unemployment spikes, income falls and recession takes hold again. Given that there is record excess capacity in the U.S. and elsewhere (especially China), unless demand resurfaces, a double dip seems a likely outcome.
How did the last double dip look?
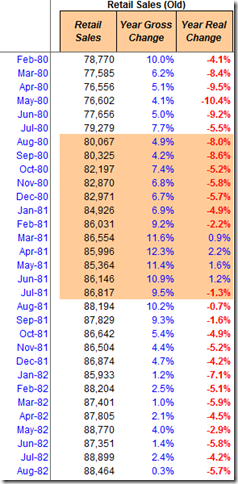
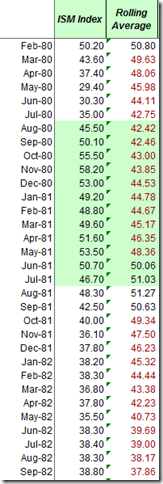
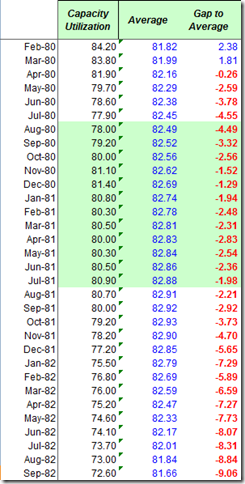
Let’s look at the double dip from 1980-1982 for a historical reference using the five economic areas the NBER tracks. In the monthly charts, the dark regions represent expansion. The white regions represent recession.
GDP
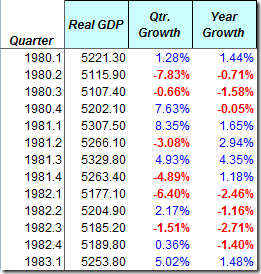
Below is the table for Real GDP statistics.
This gives you a flavor for how uneven both the recession and the recovery were. Supposedly, recession began in Feb 1980 and ended that summer, only to reappear again in the Summer of 1981 and last until November 1982.
Personal Income
The real story starts with personal income and inflation. This chart shows you how high inflation crushed income growth so that incomes started shrinking again during the expansion of 1981. In nominal terms, personal income was increasing, but not in inflation-adjusted terms.
Retail Sales
As a result, this led directly to a renewed lapse in consumer demand as evidenced by retail sales falling from March 1981.
Output
Then, looking at the ISM numbers, you can see production started to ramp up in late 1980 due to the economic improvement, but the numbers started down again in 1981 when demand buckled and went much lower in the second dip.
Employment and Capacity Utilization
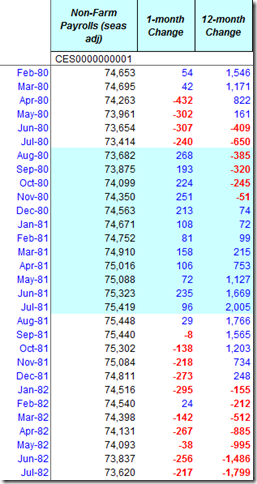
My take on this dynamic is this: capacity was very slack. As the numbers were unable to turn around and Volcker also cranked interest rates higher and higher, layoffs began in earnest again. Here are the charts on Capacity Utilization and Non-Farm Payrolls.
Inventories
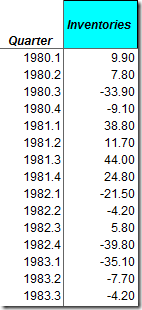
I would also add that inventories acted with a two-quarter lag, detracting from output while the economy was expanding in late 1980, and then erroneously adding to output in late 1981 even though the economy had already slipped into recession. Businesses were still purging inventories well into 1983, even though the economy had turned up in November 1983.
What to look for in 2010 for signs of a double dip
In my view this episode says a lot about what to look for in 2010 regarding sustainable growth. First and foremost, we should be looking to disposable personal income i.e after tax money consumers have to spend. Given the high debt levels in America and the need to re-build savings in a non asset-based economy, people aren’t going to spend unless they make more. Right now Personal income is pretty much flat-lining. This is a weak link for sure.
The next link to watch is retail sales. I said that the negative number for spending on basic non-durable goods in the second quarter was a bad sign. This can be overcome by inventory adjustments and government stimulus for 6 months, maybe a year. But, eventually, demand must turn up or recovery will fade.
So, in my view, the real new normal baseline output level in the U.S. economy is probably lower than where we are today. However, government spending will fill the gap temporarily. My hope is that we can reach that new lower level before any stimulus loses its punch. However, if this stimulus runs out before we get to that baseline new normal, the economy will head down again. But, because of all the built up macro disequilibria in the U.S. economy, you can bet we would head down even lower next time than this time – lower in GDP, lower in inflation, and lower in government bond yields and shares.


