Office Volume Down 50% to 91%; Industrial Space at Decade Low; Retail Vacancies at 7.5%
 Courtesy of Mish
Retail, office, and industrial real estate are all suffering to various degrees.
Let’s take a look at all three, courtesy of CoStar, starting with Rapidly Falling Prices Changing Dynamics of Office Leasing, Ownership.
The second quarter of 2009 saw leasing and sales conditions across the U.S. office market plummet at a rate unforeseen in previous analysis by CoStar Group, Inc. In particular, CoStar confirmed that the value of Class A office buildings has declined by 57% compared with prices paid at the peak of the market in 2007.
In addition, office-leasing activity is off 39% from year-ago levels and all but three U.S. office markets posted negative net absorption over the first two quarters of 2009.
“The degree and speed at which these changes in market fundamentals have occurred are staggering,” noted CoStar Group’s President and CEO Andrew C. Florance." Florance noted that, on an inflation-adjusted basis, the average price per square foot buyers paid for office properties had enjoyed an 11-year run-up beginning at the end of 1996 to their peak in the third quarter of 2007. In the past six quarters, U.S. office buildings have lost more than half their value.
The bigger the transaction, the more emphatic has been the sales volume collapse from their peaks. The number of closed office sales of $5 million or less declined an average of 58% from their peaks, while the number of sales involving office properties for $50 million or more have dropped more than 91% from their peak, Florance said.
Industrial Space Demand At Decade Low
Please consider Demand for U.S. Industrial Space Falls to Decade Low.
The industrial vacancy rate rose to 9.8% at the end of the second quarter of this year, while the amount of negative net absorption approached 100 million square feet in the first two quarters of 2009 — both highs for the decade.
Gross leasing of industrial property fell from 97 million square feet in first-quarter 2009 to 83 million square feet in the second three months of 2009 — down nearly 50% from a year earlier — while inflation-adjusted quoted rents continued a retreat that began four years ago.
Among the 20 largest industrial markets in the nation, only two registered positive absorption in 2009, the relatively small Western Michigan market and Houston. On the other end of the spectrum, Los Angeles, the seat of West Coast trade, has posted the largest negative net absorption at -9.6 million square feet, followed by Chicago, (-8.7 million SF) and the San Francisco Bay Area (-8.6 million SF), South Florida (-6.9 million SF) and Northern New Jersey (-5.3 million SF.)
Industrial sales have also dropped sharply, reflecting the lack of credit available for commercial property sales in general. Total dollar sales volume has fallen 71% and cap rates rising 35% since their 2007 peaks. Among major industrial markets, the drop-off in sales volume compared to the same period last year ranges from 30% in Atlanta to 90% in Dallas-Fort Worth, with the majority of markets have seen sales volume decline between 70%-80%.
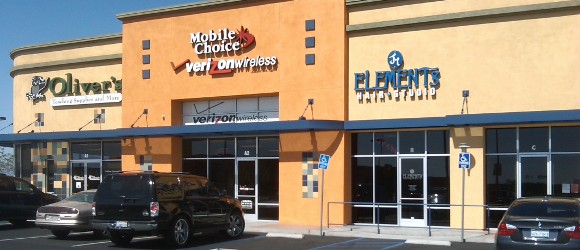
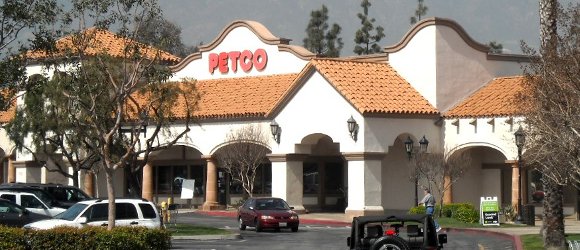
Retail Vacancies Hit 7.5%
Rounding out a trio of commercial real estate woes, Retail Markets Continue to Struggle in Q2, but Some Improvement in Sight.
"The retail sector is not seeing as much of a drop off in leasing activity as we’ve seen in the office and industrial sectors," said Spivey, showing that there was 26 million square feet of leasing activity during second quarter, which is down only 7.4% over second quarter 2008 and 10.7% over second quarter 2007.
However, continuing a trend from the first quarter 2009 when the nation’s retail market posted negative quarterly net absorption (20 million square feet) for the first time since CoStar began tracking retail trends in 2006, the U.S. retail market posted another 16 million square feet of negative net absorption during the second quarter. Spivey compared the retail sector’s historical quarterly net absorption to job growth statistics, showing the two are highly correlated, which means that once the job market improves, we should expect retail absorption to improve shortly after.
"On average, the retail sector has added about 1.4% [of square footage of total existing retail space] to its inventory each year since the ’50s," said Spivey, showing that the exceptions have been the cycles of excess development that occurred in the late ’60s-early ’70s, late ’80s, 1998 to 2001, and 2004 to 2007. Additionally, consider that the level of retail property under construction in nearly every market across the country is below this 1.4% historical average as well.
"The market has not been overbuilt in this most recent cycle. CoStar forecasts there will be about only a .7% increase in retail inventory during 2009, which would be the lowest number ever, so new deliveries are not a part of the problem this time around," said Spivey.
By retail property type, shopping centers have a much higher vacancy rate (9.2%) than general retail (5.5%), which primarily consists of freestanding, single-tenant retail buildings. Within the shopping center category, in line with those centers that have experienced the most negative net absorption, Spivey showed that strip (11.5%), neighborhood (10.3%) and community (10.1%) centers have the highest vacancy rates, which "probably has a bit to do with the ‘mom and pop’ shops not being able to whether the downturn as well as national and regional tenants," said Spivey. The centers with the lowest vacancy rates are super regional malls (3.7%), outlet centers (6.6%), and regional malls (7.1%).
At the end of second quarter, the national average retail rental rate (based on quoted asking rental rates, triple net) closed at $17.15 per square foot, which, on an inflation-adjusted basis, is down 4% over fourth quarter 2008. Spivey pointed out that the effective rental rate, which takes into account lease concessions, is likely down even more.
Retail Space Saturation
I certainly agree with Spivey in regards to jobs and vacancies being correlated. However, I disagree with Spivey’s assertion "The market has not been overbuilt in this most recent cycle."
I claim the market has hit a saturation point after decades of over-building. One gets used to seeing a certain rate, say 1.4% historical growth and concludes it is forever sustainable. It isn’t. Moreover, everywhere one looks there are miles of strip malls, Pizza Huts (YUM), Walmart (WMT), Target (TGT), Home Depots (HD), and Lowes (LOW) as noted in The Point of Negative Returns.
 With boomers headed into retirement under-funded and deep in debt, don’t expect a return to so-called "normal" spending patterns anytime soon. Consumers at long last have come to the painful realization that their home is a place to live and not their retirement plan, while banks continue to tighten lending standards across the board.
As noted in April 2008, the Shopping Center Economic Model Is History.
Pressure will remain on commercial real estate (and real estate in general) for another decade.


