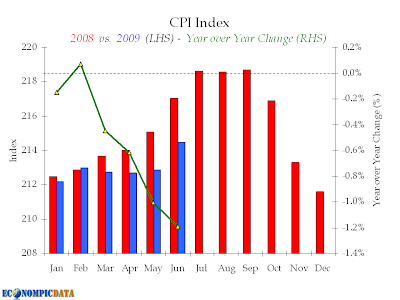
Here’s a couple from Jake at Econompic Data – on CPI expectations and net worth per capita.
Predicting CPI…
So, I got lucky and somehow predicted Q2 GDP the night before the release (as a friend of mine told me, "even the blind chicken gets the kernel of corn"), BUT I’ll try again. Economists (smarter than me) are predicting a month over month CPI print of 0.0%. I’ll go on record here that it will come in lower. To understand my reasoning, lets take a look at details from today’s July import price levels release. Marketwatch reported:
Prices of imported goods fell 0.7% in July, the first decrease since January as petroleum prices declined, the Labor Department estimated Thursday.
Analysts polled by MarketWatch had expected the import price index to fall 0.1%.
Import prices were down 19.3% in the past year, the largest annual decline since the data were first published in 1982. In June, the import price index rose a revised 2.6%, compared with a prior estimate of a 3.2% gain.
In July, imported petroleum prices fell 2.8%, the first decrease since January. The petroleum imports price index is down 49.9% over 12 months. Non-petroleum import prices fell 0.2% in July, and are down 7.3% for the year, the largest 12-month decline since the data began publication in 1985.
We can see below that the change in the import price level was largely driven by the change in fuel (i.e. petroleum) prices.
Now the significance. There has been a very strong relationship between the price level of imports and broad CPI, as changes in the price of petroleum has been the main driver of CPI. Thus, the fact that July’s import prices declined makes me think we may be in for a surprise regarding July’s CPI print. The below chart shows the longer term relationship.
Regardless of the month over month figure, expect a sizable drop in the year over year number. As we can see below, prices spiked last July as the bubble in oil was in full gear. Thus, if prices are flat month over month (as expected), the year over year CPI will move down to -1.9%.
The important question… how do you position for this? I personally own TLT (a long positon in the long bond). My view is if CPI comes in lower than expected, long bonds will rally.
So would I rather be wrong about CPI or TLT? CPI of course…
Source: CPI – BLS; Import Prices – BLS
*****
Net Worth = Net Negative over Past Ten Years
Take household net worth, then remove the effects of inflation and population growth to get real net worth per capita.
And this doesn’t communicate the widening disparity between the haves and have nots (i.e. the bottom 90% have MUCH less net worth now in real terms than in the recent past).
Source: Federal Reserve (hat tip reader Bryan Keller)


