Click here for a FREE, 90-day trial subscription to our PSW Report!
Growing evidence, number trails and a culture of greed support a connection between high frequency program trading and market manipulation and, by all appearances, the pumping up of stocks of troubled financial companies… – Ilene
More on the Massive Trading Volumes in Troubled Financial Stocks
By Brett Steenbarger at TraderFeed


This story began with simple reader inquiries concerning a stock market indicator called TRIN and their perceptions that TRIN was "broken". For the uninitiated, TRIN assesses the proportion of stock exchange volume that is going to advancing stocks to the volume attributable to declining issues. When TRIN is below 1.0, it means that volume is relatively concentrated in rising shares; above 1.0 means that volume is concentrated in declining stocks.
TRIN appeared to be broken because we were getting huge swings in its values from moment to moment in the market. It would swing wildly, sometimes going far above 1.0 and sometimes far below. I pointed out that, from a purely mathematical vantage point, this could only occur if a disproportionate share of NYSE volume was occurring in one or a handful of stocks.
Further inquiry revealed that this was, indeed, the case: I found that, not only were the trading volumes of such stocks as C, AIG, FNM, and FRE elevated, as noted the by Big Picture blog, but that their composite volumes (their volumes traded across all exchanges) exceeded that of all other NYSE stock trading! Indeed, I discovered that the 20-day TRIN was at its lowest level since 2000 because volume was highly concentrated in rising stocks. This was not just unusually heavy volume; it was unusually heavy to the buy side.
Since this volume was directional–all of these stocks had made spectacular percentage gains–and because the highly unusual activity was unique to troubled financial firms (not stable companies such as GS and JPM), I surmised that something might be afoot: a systematic attempt to bolster the shares of taxpayer supported companies that–for political reasons–could not return to the bailout well. Why such an attempt? Perhaps to reimburse the largest shareholder of the institutions and position these companies to raise capital on their own. They certainly weren’t going to raise their own capital as languishing two-dollar zombie stocks.
Of late, we’ve seen articles in the mainstream media suggesting that the volatility in these troubled financial companies’ shares is attributable to short-covering. "When large numbers of short sellers close their positions by buying shares at the same time, the stocks involved can register explosive – and often inexplicable – gains," the Financial Times article explains.
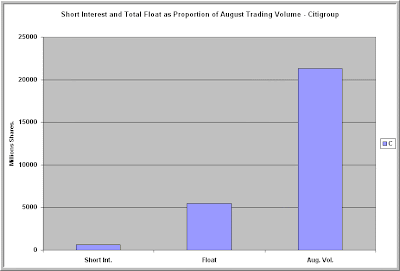
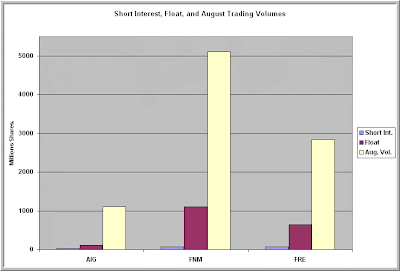
On the surface, this makes sense. The S.E.C. has been toying with the idea of reinstated curbs on short selling, and this could spark short covering among financial firms. Indeed, according to the ShortSqueeze site, C, AIG, FNM, and FRE have large short positions as of the most recent report, amounting to approximately 11%, 20%, 6%, and 10% of their total floats respectively.
 Once we look at the magnitude of the recent activity in these stocks, however, the idea that this rise is largely a function of short covering becomes implausible…
We also hear the idea from the mainstream media that some of the huge volumes in these stocks can be attributed to "daytraders". This conjures images of young guys in proprietary trading shops churning trades all day long. I know or work with a number of the largest discretionary prop firms in the country and am aware of none with the capitalization to pull off trading volumes of this magnitude…
…The only kind of trading technology I know of that is capable of such churning is high frequency, algorithmic trading. This was also the recent conclusion of Zero Hedge. Firms engaging in such strategies, including some of the largest investment banks, do indeed have the capital to trade such volumes.
Of course, these high frequency trading programs are supposed to be market making only, not drivers of directional market moves. As a federal prosecutor noted when there was an alleged theft of some of these programs, however, such technology can "manipulate markets in unfair ways"….
Read Brett’s entire "Massive Trading Volumes" article here.>>
See also:
Lehman Brothers (LEHMQ.PK) Up 200% Friday, TraderMark at Fund My Mutual Fund
Five Financial Stocks Dominating Market Volume, Zero Hedge
And recall, Phil’s analogy – this applies to stick saves in the indexes as well as to individual stocks being marked up by program trading:
"The lack of a retrace was getting downright unhealthy. As I often complain – rapid rises in the market, especially when accomplished through what we call “stick saves” create virtual air pockets in stock prices and make investing more and more dangerous as we move up. A simple example I use for members is to imagine the stock market has just 100 total shares. In March, those 100 shares were worth $1,000 and there was $1,000 sitting on the sidelines in cash. Shares are bought and sold every day but it doesn’t really matter as they are never all bought or all sold. The bottom line is that perhaps 25% of the cash actually moved off the sidelines but the market has gained 50% since March. Where does that leave us? Well that means we now have 100 shares of stock “worth” $1,500 but now there is only $750 on the sidelines to buy it.
 That makes it exponentially harder to move the market higher as the values grow as it takes more and more sideline capital to grow the market each day. Since low interest rates, unemployment and debt are still keeping the sideline capital from growing – the market holders face a diminishing pool of sellers. In fact, the entire expansion of “value” of the market is an illusion as it WAS possible in March to exchange 100% of the stocks for the cash on the sidelines for $1,000 (assuming everyone on the sidelines would make the trade). Now that we have USED 25% of the sideline money to inflate the apparent value of the stocks, we have a serious problem because, even if EVERY SINGLE DOLLAR of sideline capital were exchanged for stocks in a panic sale, there is only enough to pay out 50% of the market’s current “value.“
..If we were to have a panic event, we could have a drop that makes last year look like practice. This is the problem with moving the peg of market value up the field without letting the growth be fueled by real earnings and real capital inflows. In a normal market, stocks and sideline cash keep pace with each other as buyers and sellers balance out and the rises in the market are driven by capital inflows which come from the creation of additional REAL wealth, not the paper wealth of a portfolio increase. None of that has happened here. Real wealth was destroyed by the Trillions, the market dropped to reflect that fact but now over 25% of the stocks are back within 20% of their all-time highs…"
My Comment: So, are HFT programs being used to increase the price of stocks on a daily basis? How? If, for example, GS keeps the bid artificially high and moving higher via program trading, stock prices will rise due to GS’s volume dominance. Stock prices keep rising, but not because each share has been traded at these inflated levels, but because a small fraction of most recently traded shares were marked up higher. As Phil illustrated, there’s less money on the sidelines available to support inflated prices. What about profits achieved from HFT and pushing the market higher? Those profits may enrich the players and can be taken out of the system. So while it may appear as though value is increasing as share prices soar, support for higher prices does not truly exist.
In addition, Tyler Durden made the following observation: "Another interesting side effect that nobody talks about is how many equity follow-on offerings we have had. Ironically those peaked in June and have been sliding since. In other words, investors are unwilling to convert stock currency for cash currency. Stocks can be at 10,000 but that does not mean companies benefit from this, and in fact quite the opposite: a major trace down will have to happen before companies which are burning thru a lot of cash can access the new money on the sidelines. Absent that we will have a Nordstom’s at $100/share and with no capacity to raise any new capital. Amazing dislocation."
– Ilene


