"Safe" Investments Can Still Lose Purchasing Power
 Courtesy of Charles Hugh Smith, Of Two Minds
There is no such thing as "absolute safety" in investing because every instrument or investment is "priced" in a currency, commodity or other instrument. Thus the only way to measure performance is in purchasing power or relative strength.
Longtime contributor Harun I. provides a context for what constitutes "low-risk securities" by introducing us once again to the concept of relative strength/performance. Harun has on several occasions shared charts which plot two investments as a ratio. This illustrates that every security or investment is "priced" in a currency or commodity or other instrument.
For example: many analysts have noted that the Dow Jones Industrial Average (DJIA) has returned to its September 1999 level in nominal terms. The standard commentary notes "we’ve gone nowhere in 10 years."
Not true: owners of the Dow have lost 23% in the past 10 years as the dollar–the currency the Dow is priced in–has declined by 23% in the past 10 years of "low inflation." Priced in gold, the Dow has lost 3/4 of its value. (See below)
Harun refers to the following interview with Black Swan" author Nassim Taleb which I exerpt below: ‘We still have the same disease’ (Nassim Taleb interview)
NT: My whole idea is to lower risk in society by developing a system that can resist human error, rather than one where human error rules. The first step is to make sure that no financial institution is too big to fail. Next, make sure governments don’t favour big companies. Governments should also decrease the role of economists – they’re no more reliable than astrologers, and they do more damage.
Q: Now that you’ve painted such a rosy outlook, do you have any advice on how individuals can guard against losing 40 per cent of their money in this extremely risky world?
NT: My advice is that instead of investing in medium-risk securities, you should put most of your money in very low-risk securities, and a little bit in high-risk securities. Then you might get a good black swan. Also, it’s good to have more than one profession, in case your own profession goes out of style. A Wall Street trader who’s also a belly dancer will do a lot better than a trader who winds up driving a taxi.
Here are Harun’s comments and charts:
Mr. Taleb’s points of view are interesting. But I would like you to examine the results of his investment advice.
"My advice is that instead of investing in medium-risk securities, you should put most of your money in very low-risk securities, and a little bit in high-risk securities."
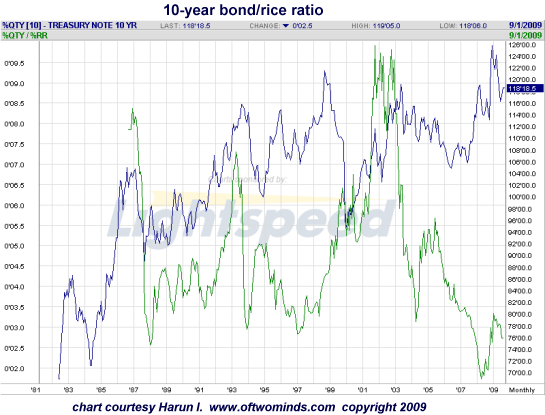
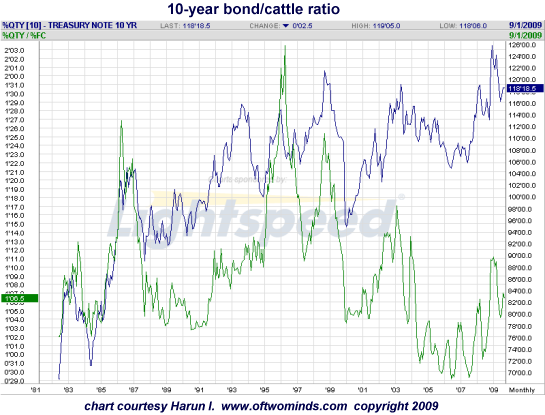
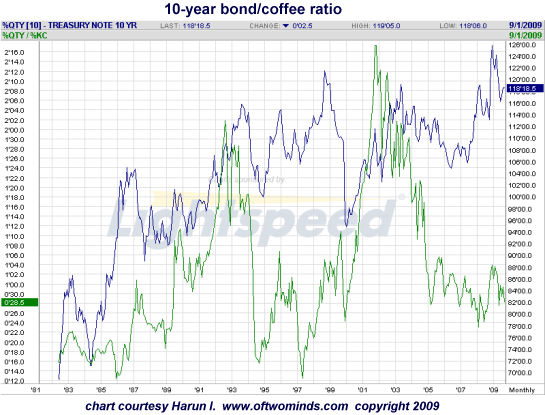
Sounds reasonable. So let’s look at the performance of what the "world" considers low risk against some everyday staples. (See charts below). The US 10-Year Note lost value against everything noted here (Unleaded Gas, Corn, Rice, Cattle, Coffee). But that is not the complete story. In most cases, buyers of these bonds paid taxes in the interest earned and fees to brokers only to find that if they sold them today they would purchase much less than they did 10 years ago.
When the green line is rising 10-Year Notes are gaining in value. There is clearly a time to be in a given security and a time not to be. As a broad stroke strategy: to be in a particular instrument all the time is incomplete and exposes the investor to potentially large losses in purchasing power.
I respect Mr. Taleb’s work but anyone following his advice must understand relative value. They also must understand that if returns do not keep up with inflation, you may get back your principle but it will buy much less. This equates to a loss.
There is no Lazy Man’s Guide To Maintaining or Growing Purchasing Power. If the Fed is successful at causing an inflation rate of 3.5% purchasing power will be cut in half every 20 years. That might be okay if you are working and receiving raises but if you are retired, having your retirement check lose half of its purchasing power is devastating not only to the individual but to the society who must now "redistribute" wealth to support the individual.
In the charts below, the the blue line plots the 10-Yr. Note prices. The ratio line, RS (relative strength) line, or spread line (all the same thing) is the green line. While RS spikes may coincide with large moves on the part of a particular instrument or both in the comparison, it is not a necessary feature. The best time to have considered the purchase of Treasuries against a particular commodity shown here was when the RS line was at a historical bottom. (emphasis added, CHS)
What I have been trying to help people to understand is that what is happening is a necessary feature of the current system. It is why Glass-Stegall had to be repealed (could any of the investment houses have applied to become commercial banks and therefore eligible for TARP funds with Glass-Stegall intact?).
Without CDS’s (credit default swaps) there was no way to expand credit at the rate necessary to avoid collapse. The argument that the $652 trillion in CDS’s are offsetting seems ridiculous once one considers that someone was on the losing side and had to pony up a collective $326 trillion (this bad debt is still out there). Saving collapsed because it had to in order to feed the debt based economic machine. Throwing the losses onto the back of taxpayers is loathsome but necessary because in the wake of the collapse of all the debt producing machines, more debt must be produced and the federal government is the only one with a printing press. But as you say, this will have consequences.
This fatal flaw is becoming widely known and it is about time we deal with it rather than papering it over, however politically untenable.
Thank you, Harun, for an explanation of relative performance and purchasing power. Harun has illustrated this by plotting ratios of the 10-year Treasury Bond against five basic commodities we buy as consumers: gasoline, corn, rice, cattle (beef) and coffee.
Relative to these commodites, the bond has lost value.
Here is the 10-year bond/unleaded gasoline ratio (green line)

Here is the 10-year bond/corn ratio (green line)

Here is the 10-year bond/rice ratio (green line)

Here is the 10-year bond/cattle ratio (green line)

Here is the 10-year bond/coffee ratio (green line)

The most striking relative strength ratio is between the Dow and gold. At the stock market’s peak in early 2000, it took about 40 ounces of gold to buy one "share" (11,400) of the DJIA. Now it only takes less than 10 ounces of gold to buy a "share" of the Dow (9,800).
Priced in gold, the Dow has lost 3/4 of its value in early 2000. The investor who sold the Dow at the top and bought gold has gained purchasing power in terms of commodities and all fiat currencies. The investor who held the Dow has lost purchasing power.
So much for "buy and hold" and "stocks always rise in the long term." I think 10 years qualifies as "the long term" and that has been catastrophically untrue for investors who bought U.S. stocks in 2000 and held.
Permanent link: "Safe" Investments Can Still Lose Purchasing Power
If you want more troubling/revolutionary/annoying analysis, please read Free eBook now available: HTML version: Survival+: Structuring Prosperity for Yourself and the Nation (PDF version (111 pages): Survival+)
Photo: Risky Business, license at Wikimedia.


