Mish discusses his thoughts on the market, drawing a few Elliott Wave patterns towards the end. – Ilene
Strenuously Overbought But …?
 Courtesy of Mish
Inquiring minds are once again reading excellent commentary by John Hussman. Please consider Strenuously Overbought.
Last week, we closed out our modest "anti-hedge" in index call options, which we have carried in the Strategic Growth Fund during recent months, and we moved back to a fully hedged investment stance. I should note that we are not “calling” or “predicting” a market decline in this particular instance. Rather, we are tightening of our defenses because the overall conformation of evidence we observe here has generally not been followed by an acceptable return/risk profile, on average.
My discomfort about strenuously overbought and moderately overvalued conditions overlaps with skepticism about the U.S. economic “recovery,” which appears to be nothing but an artifact of government spending, while intrinsic economic activity remains weak. Stimulus induced “strength” is unlikely to propagate because, as I’ve noted before, economic recoveries are invariably led by expansion in debt-financed forms of spending such as gross domestic investment and durable goods. These classes of spending tend to lead other forms of economic activity by nearly a year, and it is difficult to expect this in an environment of heavy continued deleveraging pressure. Rather than abating, foreclosures and mortgage delinquencies are setting further records (pressured even more by continued net job losses), and we have now hit the point where Alt-A and Option-ARM resets are beginning (after a lull in the reset schedule since March). We know that post-crash markets feature partial recoveries followed by a very extended period of sideways movement. To expect an entirely different result in this instance – to assume that this is a typical post-war recovery and that everything is back to normal – seems hopeful to say the least.
The percentage of bullish investment advisors now rivals that seen at the 2007 peak. Stocks are strenuously overbought. The S&P 500 is overvalued to the extent that we now expect just a 6.6% annual total return over the coming decade (a level that except for the period since the mid-1990’s has corresponded more to bull market peaks than bases for sustained advances). Historically, such combinations of overbought, overvalued, overbullish evidence have generally been unrewarding, so we don’t even need to consider special cases. However, recent (and in my view continuing) economic conditions are nothing if not a special case, and the historical parallel I am most concerned about is the one with the closest overlap to this one.
Comparison To April 1930
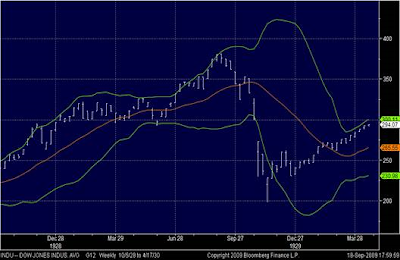
Hussman has a series of 4 charts comparing the situation now with 1930. So as to induce you to read Hussman’s entire article I will only post two of them.
S&P Weekly Chart December 2005 – Present
Dow Weekly 1928 – Spring 1930
History Rhymes
History sometimes repeats and sometimes rhymes but that is not a guarantee it does so again. Nonetheless, valuations are stretched to ridiculous levels and so is sentiment. These are not conditions in which (on average) it pays to be long.
Ewave Update
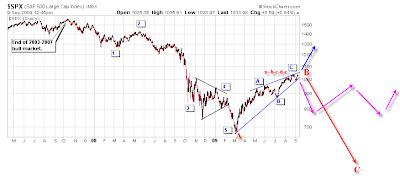
Here is chart that I have been following. The chart is from September 9th but I can verbally discuss differences.

click on chart for sharper image
The above chart shows several different possibilities of what may happen. These are not the only patterns in play which is why I have refrained from commenting until now. However, the odds are increasing that one of these patterns is it, thus the following discussion.
That rising wedge can now be counted as an a-b-c-d-e bearish rising wedge, possibly representing a massive corrective "B" wave up. With that labeling, the 5 waves down into March is an "A". In this scenario, wave "C" will take out the March low. This is the most bearish outlook and one that I am increasingly in favor of. It would match what happened in the Great Depression.
A second likely possibility is a "bottom may be in but we are not going anywhere" for a long time scenario. Perhaps new lows are made ultimately, perhaps not. Such a scenario would play out similar to the "Lost Two Decades" In Japan. Please see my October 23, 2008 post S&P 500 Crash Count Compared To Nikkei Index for details.
The least likely possibility but one that needs to be considered is a scenario in which the rising wedge breaks North in a sustained way (as opposed to temporary headfake). Were this to happen, it would likely be in connection with a collapsing US$. Although a possibility, bearish US$ sentiment is so extreme that it cannot be considered a strong likelihood at this point.
Fundamentally, technically, and sentimentally conditions are ripe for a strong retrace of a major portion of this move up. But…. That does not mean it will happen.
Photo: Chapaev and South Inylchek Glacier, by Simon Garbutt (SiGarb), at Wikimedia.


