This debate – inflation vs. deflation – illustrates how important it is to agree on definitions first, in order to engage in a more productive exchange of ideas, second. – Ilene
Daniel Amerman vs. Mish: Reflections on the Great Inflation/Deflation Debate
Courtesy of Mish
Last week I was in an inflation vs. deflation debate on Financial Sense with Daniel Amerman. The debate was moderated by Jim Puplava. It is a credit to Jim that he is willing to entertain both sides of an argument even though he himself is an inflationist.
Amerman took the inflation side, and of course I took the deflation side.
One of the main rules of any debate is to agree on definitions. In this case, there was no agreement.
I believe inflation is an increase in money supply and credit while Amerman considers inflation to be a purchasing power phenomenon. This lead to different opinions as to whether or not we are in deflation.
Furthermore, as with any audio discussion, there was an inability to point to charts or written material to make a case.
Let’s now explore some of the issues that came up in the debate starting with Amerman’s post Puncturing Deflation Myths
Japan & “Where’s The Beef”?
As discussed in Part One, someone who had attended one of my inflation solutions workshops asked me to debate deflation theory with him. I said “fine” but with one condition: before I would debate theory, he needed to first provide a real word example of this problem actually having happened. Could he answer this simple, real world question:
Name an example of a modern, major nation where the domestic purchasing power (as measured by CPI) of its purely symbolic & independent currency uncontrollably grew in value at a rapid rate over a sustained period, despite the best efforts of the nation to stop this rapid deflation?
The problem with this line of reasoning is agreement on the definition. One could just as easily define inflation as the number of meteors visible to the naked eye at nightime and conclude inflation is a cyclical phenomena that peaks every August in conjunction with the annual Perseids Meteor Shower.
Amerman did not "puncture deflation myths" because there is no agreement that his definition is the correct one.
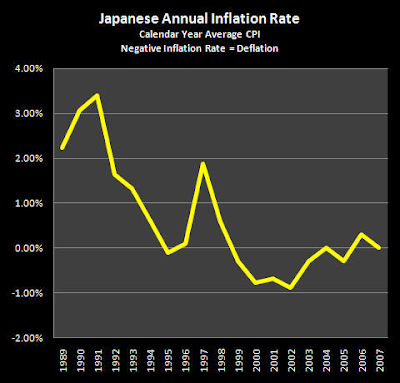
Interestingly, he does post this chart that shows, even by his definition that Japan had 5 years of negative CPI inflation.
By his own chart, Japan spent a fair amount of time with a negative CPI yet Amerman dismisses the results because the CPI was not plunging "uncontrollably".
Six Fallacies
Amerman goes on debunking 6 fallacies of his own making as if they represented some sort of deflationist viewpoint.
- Fallacy One. The belief that a “dollar” is a “dollar” and that the deflationary history of gold standard currencies applies to symbolic currencies (an “apples to oranges” fallacy).
- Fallacy Two. The belief that the US Great Depression proves the case for unstoppable monetary deflation during depressions, when it in fact proves that a sufficiently determined government can immediately break monetary deflation at will, even in the midst of depression.
- Fallacy Three. The belief that inflation and deflation take wealth from all of us equally, when what they actually do is redistribute the wealth among us.
- Fallacy Four. The widespread belief that Japan experienced powerful price deflation that the government was powerless to fight. It didn’t.
- Fallacy Five. The fundamental mistake of thinking that “deflation” is “deflation”, which leads to confusing price deflation with asset deflation, and means missing the real lessons and dangers of what happened in Japan, which is the persistent asset deflation that has defeated all government interventions (another “apples to oranges” fallacy).
- Fallacy Six. The dangerous belief that deflation protects you from inflation.
Those are not six fallacies. Those represent a strawman that does not exist.
In regards to Fallacy Six Amerman says "Collapsing credit availability and the resulting collapsing money supply leading to an unstoppable and rapidly rising value for a symbolic currency (price deflation) is a popular theory – but it has never happened in the real world."
If that is such a popular theory then let’s see who said it. I sure didn’t!
These "deflationists say" kind of arguments need a quote to show they really do exist. I would like to see a "Weiss said" or a "Prechter said" or a "Mish said" so as we can see who, if anyone is holding such views.
Yes, I am aware that Weiss has recently changed his tune from deflation to inflation. After this length of time, it is more likely to be a contrary indicator as opposed to anything else.
What Does and Should the CPI Reflect?
In regards to the CPI, I pointed out during the debate that the CPI was currently way overstated because it did not include housing prices. Amerman objected because homes are assets.
Yes they are. However, motorcycles, autos, frozen pizzas, and even tomatoes are assets. Land is also an asset, and so are stocks and bonds. Of those, only land, stocks, and bonds are not consumables.
Autos and motorcycles are in the CPI, so should houses. A house not maintained (heated, painted, air conditioned, etc), will quickly deteriorate with one or more of the following: dry rot, mold, mildew, termites, etc. A house not maintained will quickly be "consumed".
One might argue that homes are a very long term asset, but so is a bag of rice or a can of tomatoes or a that might last 20 years on a shelf. Clearly, longevity is a poor measure of what belongs in the CPI.
Indeed, one of the biggest mistakes the Greenspan Fed made was ignoring rapidly rising home prices and its effect on the economy. Had the Fed properly included home prices in the CPI, it would not have left interest rates as low and as long as he did, unless of course his action was to purposely create a bubble.
What’s the Real CPI?
Inquiring minds are thus wondering What’s the Real CPI?
OER, Owner’s Equivalent Rent (rental prices) is the largest component in the CPI, weighing in at 24.433%.
Watch what happens when the Case-Shiller Housing Index is substituted for Owner’s Equivalent Rent (OER) in the CPI.
Case Shiller CPI vs. CPI-U
click on chart for sharper image
The above chart is courtesy of my friend "TC".
CS-CPI fell at the fastest pace on record to measure at -6.2% year over year (YOY). Meanwhile the government’s CPI-U declined at the fastest rate since the 1950s at a -1.3% YOY pace.
Since the housing market peak in June 2006 OER is up +7.6%, while the Case-Shiller index is down -32.6%, an amazing 4020 basis point divergence!
CS-CPI Year over year has now fallen for 8 consecutive months and 11 of the past 15. High Year over year comparison data points for the next several months will likely result in CPI deflation coming in at -7% to -8% in the coming months.
 Closer Look At "Uncontrollable"
The above chart certainly looks like an uncontrollable plunge in the CPI. Moreover, in Japan, the Japanese central bank tried for a decade to get prices to go up and stay up. The Bank of Japan failed.
Clearly, neither the Bank of Japan, nor the Fed is in "control" of anything. Yet, as I have pointed out on many occasions, Belief In Wizards Runs Deep.
The most amazing thing about this persistent belief in wizards is Bernanke’s Deflation Preventing Scorecard is a perfect zero!
Indeed Bernanke tried all 12 things he said in his famous helicopter speech on preventing deflation, yet deflation by any practical measure arrived anyway.
Is Bernanke a Wizard?
Bernanke is not a wizard and neither is Greenspan. The difference is Greenspan had the wind of consumption blowing briskly at his back. Bernanke is on the backside of Peak Credit with a breeze of frugality blowing briskly in his face.
Attitudes make all the difference in the world.
Money Supply Argument
Others have attempted to make the case that Japan never went into deflation on the basis of money supply. For those in the strict monetarist camp, the only thing that matters is a growing money supply.
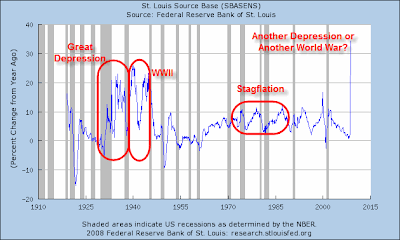
Some interesting things appear when using that line of reasoning. Please consider the following chart.
Rate of Change In Monetary Base

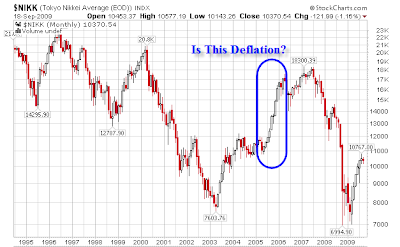
Using rate of change in base money supply as a measure of inflation and deflation would have one conclude that Japan went into deflation between 2005 and 2007 even though the stock market was soaring as shown in the following chart.
Nikkei Stock Index
Humpty Dumpty On Inflation
I believe a definition should be practical.
Assuming we can all agree that the US was in deflation in the 1930’s, then let’s discuss the conditions at the time as well as what happened to cause those conditions.
Please consider Humpty Dumpty on Inflation
Practical Definitions Of Inflation And Deflation
Most know my definitions by now but here they are again for convenience.
- Inflation is a net increase in money supply and credit.
- Deflation is a net decrease in money supply and credit.
In both cases credit must be marked to market to make any practical sense out of what is happening. Those who focus solely on money supply cannot easily explain stock markets that have fallen in half (this does not happen in disinflation), TIPs yields, a global race to ZIRP, or many other events that are happening.
Humpty Dumpty Defines Inflation
Unfortunately there are many definitions of inflation and deflation strewn about. Some play the role of Humpty Dumpty changing meanings at whim, switching from commodity prices, to consumer prices, to expansion of base money or M3 or whatever measure of money seems to be expanding at the fastest rate.
Some do the inflationista two-step to avoid admitting that we are indeed in deflation, choosing instead to call it "disinflation"
In short: "We are going to have a period of deflation that we will instead call disinflation."‘When I use a word,’ Humpty Dumpty said, in a rather scornful tone,’ it means just what I choose it to mean, neither more nor less.’
‘The question is,’ said Alice, ‘whether you can make words mean so many different things.’
‘The question is,’ said Humpty Dumpty, ‘which is to be master – that’s all.’
In Humpty Dumpty I posted the following chart:
 Base Money % Change From A Year Ago
That chart would look much worse now at the right end.
The important take-away however, is the similarity between the spike in money supply in the great depression and the current spike.
As noted in the above Japanese money supply chart, Japan went through spikes as well as collapses in money supply. The second huge collapse came as Japan temporarily came OUT of deflation. (Of course Japan is back in deflation again after a brief sit on the sidelines.)
Be Mindful of the Fed
One reasonable indicator of deflation is what the Fed and Central Banks are doing to fight it. The reason the Fed is fighting deflation with an alphabet soup of lending facilities and other programs is simple: The US is in deflation.
At some point the Fed will, just as Japan did, reduce the money supply. If and when that happens it will mark the Fed’s belief that deflation is no longer a threat.
Ironically, those who consider inflation as a strict expansion/contraction of money kind of thing might conclude the US is going into deflation just as it is coming out of deflation.
A Practical Look At "Flation"
Here is a table of conditions from the Humpty Dumpty article as to what one might expect to see during periods of inflation, deflation, stagflation, hyperinflation, and disinflation. Some expectations are debatable so I left those blank.
click on chart for sharper image
That chart is from December 11,2008 thus some may disagree with where a few of the marks are.
Still others might suggest that treasury yields are now rising and the bottom in treasury yields is in. Certainly at 0% the short end of the curve has bottomed, and perhaps the long end has too.
However, as a practical matter, the 10-year treasury yield at 3.37% is amazingly low, especially in light of the fact that hard-core inflationists expected yields to do be soaring to 10% based on misconceptions about the CPI and/or money supply.
Symptoms vs. Definition
Bear in mind the above table is a table of symptoms one would expect to see in deflation. A practical test of a good definition inflation and deflation is whether or not one would have predicted those symptoms based on their definition.
Those following money supply or the CPI certainly could not have reasonably expected a simultaneous massacre in both the stock market and treasury yields in conjunction with rising corporate bond yields.
Those who could see and understand what a collapse in credit would do, had no such problems. Amerman and other try and skirt this issue by distinguishing between monetary deflation and asset deflation.
The fact of the matter is, in a credit based economy, deflation will always manifest itself as "asset deflation". Yet, not all "asset deflations" constitute deflation. A good example of this is the stagflationary conditions of the 70’s where stock prices fell but interest rates soared. Clearly, those times were not a period of deflation.
Those focusing on credit do not have to go through hoops explaining such things away, and as noted above, only those who considered credit in their analysis of the situation got both assets and interest rates correct, ahead of the pack.
Definitions that rely on one symptom, when there is a plethora of symptoms related to deflation are more than suspect, they are out and out faulty.
Mish Treasury Calls
So as to show I am not perpetually bullish on treasuries, here are a few links describing my positions and how they have changed.
Sunday, January 20, 2008: Time To Short Treasuries?
Kass Says Sell Bonds Short.
Kass: The bond market is in a bubble that is reminiscent of (and quite possibly as extreme as) other bubbles during previous eras. From my perch, the only issue is the timing of this trade.
Mish: Timing is indeed everything and perhaps there is a temporary selloff. But the primary trend is for lower yields. Perhaps much lower yields. There is no bubble in bonds. Not yet.
There is no bubble in treasuries if you look closely at the fundamental issues. Those who want to see how low treasury yields can get and stay there, need to look at Japan. Yields in the US are going to go far lower and stay lower longer than nearly everyone thinks.
Thursday, June 26, 2008: Is The Inflation Scare Over Yet?
Those focused on the CPI failed to see any chance of the Fed Fund’s Rate at 2.00 again. On the other hand, those focused on the destruction of credit from an Austrian economic perspective got this correct. That is just one reason why it makes more sense to watch the credit markets than the CPI. The second is the CPI is so distorted it is useless.
In my opinion, it is very likely new all time lows in the 10-year treasury yield and 30-year long bond are coming up.
Tuesday, January 06, 2009: Reflections On 2008, Themes For 2009
It is quite possible the lows in treasury yields are in. Unlike 2008 where I was constantly beating the drums for lower yields, 2009 could be different. Here are the facts: 3 month and 6 month yields hit 0% and the 10 year came close to hitting 2%. Could there be lower yields still? Yes, quite easily. Is it worth playing for other than as a hedge or part of an overall investment strategy? No.
I am now bullish on treasuries again. It will not be for forever.
Comparison To April 1930
In regards to the current reflation effort,
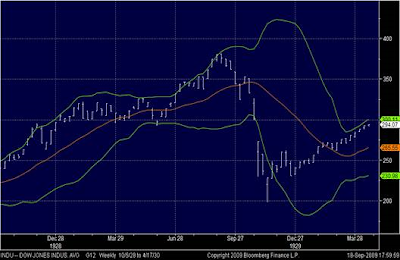
One must make allowances for "short-term noise". There was a huge stock market rally in 1930 as well. Please consider the following charts from Strenuously Overbought But …?
S&P Weekly Chart December 2005 – Present
Dow Weekly 1928 – Spring 1930
The preceding two charts are courtesy of John Hussman as noted in the article.
Simply put, 6 months is hardly a reasonable timeframe in which to declare "Goodbye Deflation, We Hardly Knew You"
Looking Ahead
Looking ahead, as I noted Thursday morning, it should be clear we are Following the Footsteps of Japan.
Japanese GDE from the 1989 peak to Present
US GDP 1999 peak to Present
Offset is 10 Years
See above link for further discussion.
Yet, as noted above, the situation is dynamic, and can change at any time. To stay ahead of the game, one needs to monitor credit conditions not just the CPI or money supply.
I cast my lot with Australian Economist Steve Keen as noted in Global Debt Bubble, Causes and Solutions.
Discussion of Unfunded Liabilities
One of the topics of discussion in the debate was on unfunded liabilities such as Medicare, Medicaid, and Social Security.
Jim Puplava, Daniel Amerman, and I all think this is a problem. Indeed I do not know of anyone, deflationist or inflationist who does not see it as a future problem.
The real question is the timing of the problem. I would argue, as I believe Prechter would, that the far bigger problem NOW, is the ongoing destruction of debt on the balance sheets of banks, and the consumer defaults, bankruptcies, and foreclosures that will continue unabated along with rising unemployment.
Only after the repudiation of consumer and commercial debt (especially commercial real estate debt) should one expect significant market ramifications of those unfunded liabilities.
Can Government Inflate the Debt Away?
Amerman suggested that government would inflate those unfunded liabilities away by further cheapening the US dollar so that it is only worth a nickel. Such arguments show a lack of understanding about the ongoing dynamics of the situation.
The reality is is it impossible to inflate those liabilities away. The reason is simple. As the value of the dollar sinks, the amount of liabilites rise. Unfunded liabilities are a current "estimate" as to what future costs will be, not a fixed price that can magically be inflated away.
Moreover, such arguments ignore things like interest on the national debt.
Finally there is another dynamic at play: demographics. At some point, after enough boomers die, boomers will no longer be the largest demographic group. When that occurs and after we have a new Congress more concerned about their generation than the baby boomers, we could see huge shift in attitudes towards defaults, as well as shifts in priorities as to what gets funded or not.
Whether that attitude shift occurs is debatable, but what is not debatable is the situation is not only dynamic, but dynamic on multiple fronts.
Do the Symptoms Match the Definition of the Disease?
When it comes to inflation and deflation, if the symptoms fit the disease and the definition predicts the symptoms in advance, the definition is reasonable. If not, then something is wrong.
I am sticking with my definition as noted in Fiat World Mathematical Model.
Amerman’s definition falls flat, he did not debunk deflation myths anymore than a definition basted on meteors would. Moreover, most economists would agree that Japan went through a period of deflation. Finally, based on an analysis of conditions one would expect to see in deflation, the US is in a period of deflation now.
There is no other reasonable conclusion, unless one is Humpty Dumpty. The debate now is not whether we are in deflation or not, but rather how long it lasts and why.


