Reflections On Market Sentiment
Courtesy of Mish
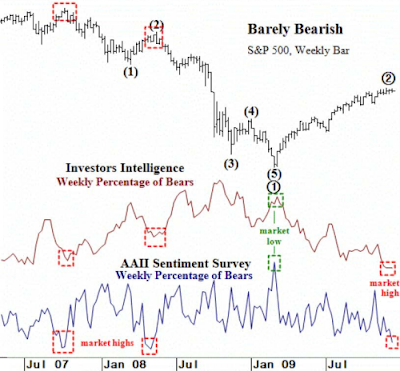
Here is one of the charts from the article.
click on chart for sharper image
Both of the popular weekly sentiment surveys are in agreement showing an extremely bullish mood, which should make any contrarian stand up and take notice. It now stands two standard deviations below its 1 year average. The AAII weekly sentiment survey of retail investors in the US has only 23% bears and a whopping 49% bulls. The AAII ratio hasn’t been this lopsided since May 2008 when the S&P 500 topped out at 1440.
Similarly, the Investors Intelligence survey of newsletter editors has plumbed new depths from last week and reached a new record. We haven’t seen this few bears in 22 years! The II finished off the year with only 15.6% of editors looking forward to lower stock market prices and 51.1% optimistically looking forward to the continuation of the rally.
The keepers of the Investors Intelligence survey, Mike Burke and John Gray, believe that while “some additional gains may occur in the near term, stocks may peak in the first quarter of next year and correct from there.” Smoothing out the weekly results with a 10 week average of the bulls divided by the bulls and bears shows that the market is overbought by 71% – the last time it was at similar lofty levels was back in late July 2007.
There are three other charts in the article and much more analysis. Inquiring minds may wish to take a look.
My friend "BC" who sent me the link writes "Today’s increasingly bullish sentiment is consistent with a B (or 2) wave, which would imply a setup for the most destructive (for financial wealth and confidence) phase of a C-wave decline, lasting 2-3 years. "
What "BC" is describing is similar to the sucker bounce in the early 1930 after the stock market crash of 1929.
I am pleased to inform that "BC" has partially come out of the closet. He is now blogging anonymously at the Economics of Oil Empire and Peak Oil blog.
Here is a link to his post Equity Market Sentiment with more of his thoughts as well as additional charts.
Addendum:
I was informed by a reader that the chart in this post is from the December 18th edition of The Elliott Wave Financial Forecast Short Term Update.
Trader’s Narrative used it without proper attribution.
I have permission from Elliott Wave.


