USA Today: Jobs May Rebound In 2010 – OK But Where Will Unemployment Be?
Courtesy of Mish
The USA Today says Jobs May Rebound In 2010.
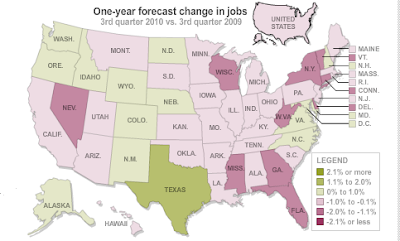
The article has some very nice interactive graphs showing state by state forecasts. The charts below that I copied are not interactive.
The chart above is confusing because it does not match the headline. The reason is the chart is showing third quarter 2009 vs. third quarter 2010, while the headline "rebound" is for the whole year.
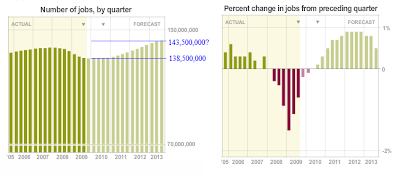
I am very interested in projecting unemployment. Unfortunately charts in the article do not list numbers precisely. However we can roughly extrapolate from these charts.
I added the lines in blue. Without knowing the precise numbers I can easily be off by a million or more, but assuming the charts are to scale, the USA today forecast is approximately 143.5 million jobs by the end of the 2013.
I think that is an extremely optimistic number but let’s see what the unemployment rate would roughly look like if no jobs are added in 2010, then we hit 143.5 million employed at the end of 2013, with 2012 adding the most jobs.
For this scenario, I assumed the number of jobs to keep up with birthrate and immigration (plus return of marginally attached and discouraged workers) is 120,000 a month.
Projecting The USA Today Unemployment Rate
That certainly does not look very pretty does it?
Yet, I assumed some moderately favorable things.
1. No double dip recession
2. A shrinking monthly labor pool rate shrinking from +120,000 down to +70,000 by 2020 (this lowers the unemployment rate)
3. No second recession for an entire decade
Note the unemployment rate is above 10% at the end of 2013 and still above 8% at the end of the next decade.
You can download my spreadsheet and create your own charts automatically using your own assumptions. Click here to download the USA Today Unemployment Scenario as shown above.
Methodology Described
To understand the methodology to change the chart and to see my baseline scenario please see Mish Unemployment Projections Through 2020 – It Looks Grim.
My baseline scenario has the unemployment rate at 10% all the way out to 2015.
Mauldin Scenarios
For scenarios by John Mauldin please see Mapping Unemployment – You Make The Call – Downloadable Spreadsheet
Mapping The Bernanke Recovery
I also mapped the Fed’s forecast in Bernanke’s Outlook For Recovery and What It Means For Jobs.
….
Inquiring mind just might be interested in mapping Bernanke’s statements. Let’s assume it takes 100,000 jobs per month to absorb new entrants, decreasing to 70,000 a month by 2020.Bernanke says jobs will be scarce for some time. He did not define "scarce" or give a timeline. However, let’s assume jobs will be scarce only for 1 year. Also let’s assume unemployment will rise for about a year (while jobs are scarce), level off, then start dropping in accordance with the paragraphs in red above.
Scenario "B"
Scenario "B" Suggests 100,000 jobs per month from 2010 through 2013 will be needed to keep up with birthrate and immigration. I took the liberty of helping out Bernanke by assuming demographics would start lowing the number of jobs required after 2013.
….
Click here to download the Bernanke Unemployment Scenario as shown above.
Sharp minds may notice that the Bernanke scenario initially assumes 100,000 jobs a month to keep up with demographics while the USA Today assumption is 120,000 jobs a month.
The reason is the faster the growth in jobs, the more likely discouraged workers and marginally attached workers will start seeking jobs. As of November 2009 there were 2.3 million marginally attached workers. Were they all to seek jobs in a year, the number of job seekers would go up by 192,000 a month, not the 20,000 I generously showed.
Thus, my assumptions were quite favorable for holding down the unemployment rate, as opposed to artificially inflating it.
By the way, those 2.3 million marginally attached potential job seekers will not only keep the unemployment rate structurally high, they will also pressure wages for years down the road.
If I can get hard numbers from USA Today, I will plug them into a new, quarter by quarter spreadsheet for as far out as USA Today is willing to provide data.


