Charts courtesy of Market Tamer
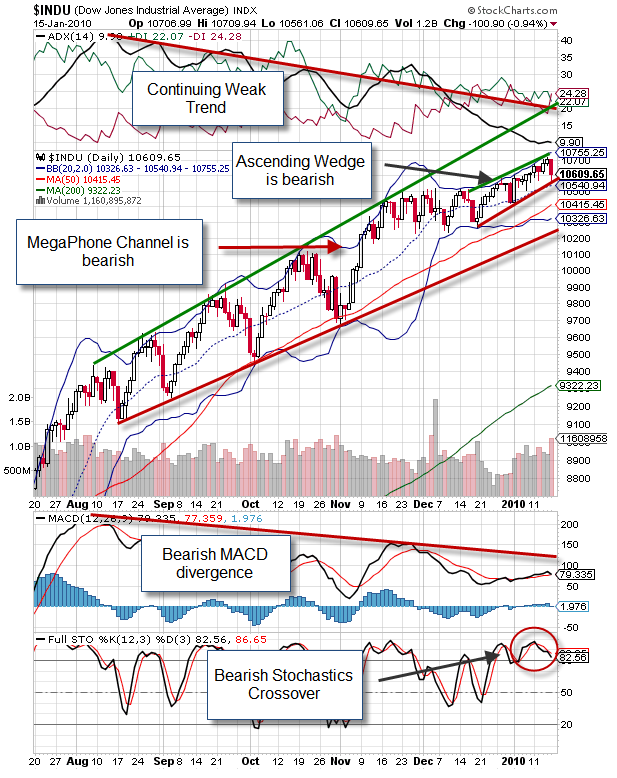
Dow Jones

S&P 500

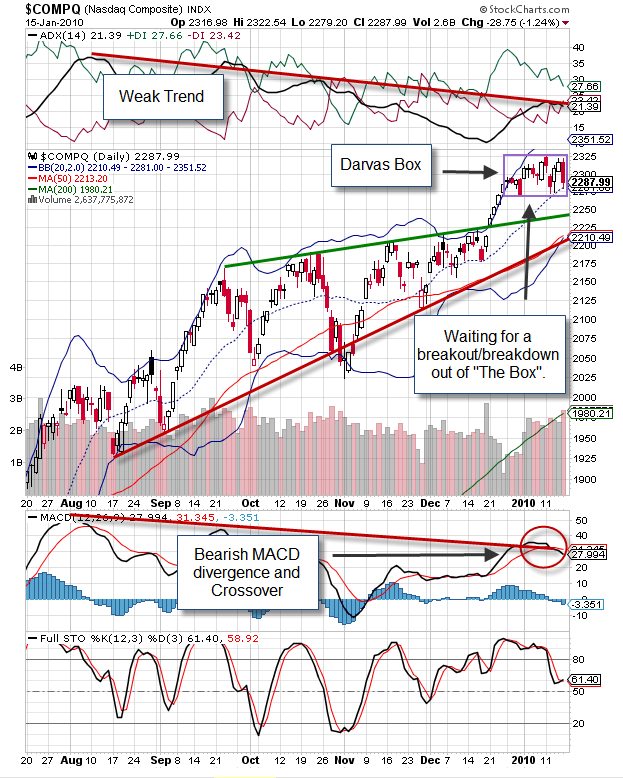
NASDAQ

Technical Talk: The Descending Wedge Chart Pattern
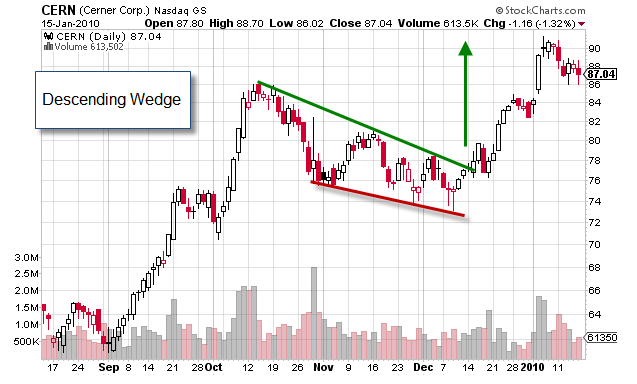
· This is a falling and converging channel pattern. It looks like the beginnings of a triangle as both trend lines are falling and converging.
· The lower trend line is putting in lower lows, but not at the pace of the upper trend line. The pattern has bullish implications as the stock will usually break to the upside out of the channel.
· The pattern can be found in both bullish and bearish markets.
· When in a bearish market, the pattern is defined as a reversal pattern.
· When in a bullish market, the pattern is a continuation pattern.
· The stock is putting in lower lows, but at a slower rate than the highs.
· Volume is diminishing indicating a lack of conviction in driving the stock lower.
· When the stock breaks the upper trend line it will usually be on increased volume as the stock breaks out of the channel to the upside.


