Courtesy of Market Tamer
Market Snapshot
ECONOMIC REPORTS
MONDAY 2/1 Personal Income, Personal Spending, Construction Spending, ISM Index
TUESDAY 2/2 Pending Home Sales, Auto Sales, Truck Sales
WEDNESDAY 2/3 Challenger Job Cuts, ADP Employment Change, ISM Services, Crude Inventories
THURSDAY 2/4 Initial Claims, Continuing Claims, Productivity-Prel, Unit Labor Costs-Preliminary, Factory orders
FRIDAY 2/5 Nonfarm Payrolls, Unemployment Rate, Average Workweek, Hourly Earnings, Consumer Credit
EARNINGS OF NOTE
MONDAY 2/1 ACV, APC, GCI, HUM, MNKD, PCL, SOHU, TUP
TUESDAY 2/2 AFL, ADM, CTRP, CMI, DHI, FISV, JDSU, MTW, MAN, MRO, MEE, MET, MYGN, NETL, PBG, SU, DOW, HSY, UPS, UNM, GRA, WHR
WEDNESDAY 2/3 AKAM, AMP, BDK, BRCM, CBG, CSCO, CMCSA, EFX, HMC, INSP, IP, MWW, NOV, NVLS, PFE, RL, BCO, TWX, V, WLT, YUM
THURSDAY 2/4 BEBE, BKC, CME, CI, DB, DO, GSK, HIT, K, MA, MCO, NOC, PENN, PBI, SLE, SNE, HOT, SUN, TM, UIS
FRIDAY 2/5 AET, AON, BZH, PC, TSN, WY
Stock Market Insights: The Cash Flow Statement
Cash is king! Liquidity in the form of cash tells us that the company can meet its obligations. The Cash Flow Statement is the third and last statement that we will touch upon. The statement is filed quarterly and year over year in concert with the Profit and Loss and Balance Sheet. The Cash Flow Statement is a measure of incoming and outgoing cash from its business operations for a specific point in time. The statement further defines the cash flow of the company that is indicated on the Balance Sheet. There are two methods of accounting that are used 1) accrual and 2) cash. Most companies use the accrual method which accounts for goods delivered as sales regardless of whether they have been paid for or not. The outstanding balance is shown on the Profit and Loss Statement under accounts receivable.
The Cash Flow statement typically divides the accounting for cash into three areas 1) Operating Activities 2) Investing Activities and 3) Financing Activities. It is most favorable if the company is creating their cash flow from Operating Activities as opposed to the other two. The reason is that if the company can sustain its operations from daily operations as opposed to investment returns and financing, it shows company strength. Be careful to take note of how large of an impact that depreciation has on the Operating Activities bottom line. Depreciation does not actually contribute cash to the company; it is more of an accounting item.
So, what are we looking for as investors in the Cash Flow Statement? A company with a smaller percentage of capital expenditures, (which is found under Investing Activities) is spending less of the company’s net earnings to remain competitive. It is also prudent to look for a company that uses its cash to buy back stock. Stock buyback activity tells the investor that the company believes its stock is a bargain and if they feel that way, that is a good sign. The other outcome to stock buyback is that it reduces the outstanding shares and will therefore increases the earnings per share which should at some point increase the value of the stock assuming that the multiple remains constant. You can find this information under the Financing Activity section of the Cash Flow Statement.
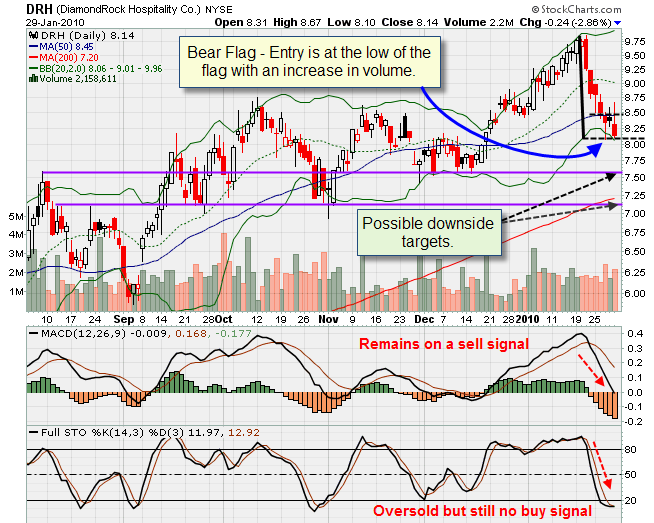
Technical Talk: The Bear Flag Chart Pattern
• The inverse to the Bull Flag, the Bear Flag is a bearish continuation pattern that appears in a downtrend after a significant bearish move with volume.
• The Bear Pennant is very similar to the Bear Flag. The difference is that the consolidation is in the form of a small symmetrical triangle. The bearish entry is just below the lower trend line of the triangle.
• The stock will cease its descent as shorts cover their position. The stock should consolidate in a sideways to slightly bullish fashion with decreasing volume.
• A short entry can be entered when the stock breaks the low point of the flag. The target should be the initial move down added to the bearish breakdown point. Look for increased volume on the breakdown from the flag.
• The stock falls quickly on increasing volume and smart traders begin to take profits as the stock moves sideways to up on decreasing volume.
• Once the bottom side of the flag is violated, it provides a high probability entry for a bearish trade provided volume increases on the break out.
• The projected target is the length of the initial move down to the flag added to the breakdown point out of the flag. Increased volume on the move will confirm the quality of the continued bearish sentiment.


