Unsustainable Spending Trends in Graphical Form; Monthly Treasury Statement February 2010
Courtesy of Mish
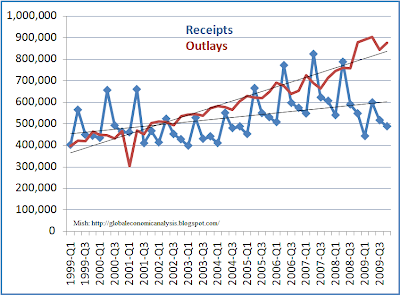
Inquiring minds are investigating Monthly Receipts, Outlays, and Deficit or Surplus, Fiscal Years 1981-2009 as published by the US Treasury on its Monthly Treasury Service report.
Here are a couple charts I produced off the downloadable spreadsheets.
Receipts vs. Outlays by Quarter 1999 Q1 Thru 2009 Q4
Deficit or Surplus by Quarter 1999 Q1 Thru 2009 Q4
click on either chart for sharper image
Receipts are back in the range of where they were in 2002-2003 while outlays have gone through the roof. Trendlines drawn by Excel. Notice the widening gap between receipts and outlays in the first chart.
Can anyone say "Unsustainable?"


