Two more installments of Pharmboy’s TA book – chapters 3 and 4. See chapters 1 and 2, here and here. – Ilene
Fundamental vs. Technical Analysis
Courtesy of Pharmboy
There are many different ways to assess the value of a company, and the methods used to analyze securities and make investment decisions fall into two very broad categories: fundamental analysis and technical analysis. Fundamental analysis is a method of evaluating a security that entails attempting to measure its intrinsic value by examining related economic, financial and other qualitative and quantitative factors. Fundamental analysts attempt to study everything that can affect the security’s value, including macroeconomic factors (like the overall economy and industry conditions) and company-specific factors (like financial condition and management).[1] Technical analysis takes a completely different approach. It is a method of evaluating securities by analyzing statistics generated by market activity, such as past prices and volume. Technical analysts do not attempt to measure a security’s intrinsic value, but instead use charts and other tools to identify patterns that can suggest future activity.[2]
Figure 12. Technical analysis noted on the graph, Fundamental analysis income statement.
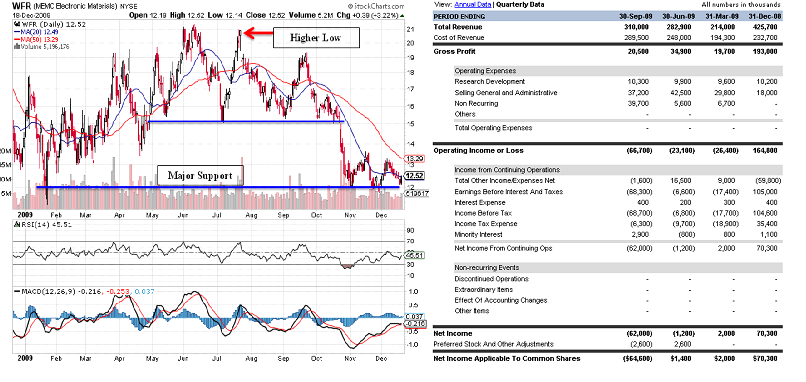
Out of the two, fundamental analysis is the more widespread discipline, by far. There is a lot of criticism concerning technical analysis, and the criticisms are derived from the Efficient Market Theory. The Efficent Market Theory states that the market’s current price is accurate and correct and that past information (same as charts) is already discounted into the stock. There are variations of this theory; however, most of these people believe that if technical analysis works then market efficiency may be questionable.
There are many papers, in fact, that say TA is often more reliable and profitable using a few finely derived rules. Ramazan Gençay wrote a paper entitled, “The predictability of security returns with simple technical trading rules.” Here is the abstract:
Technical traders base their analysis on the premise that the patterns in market prices are assumed to recur in the future, and thus, these patterns can be used for predictive purposes. This paper uses the daily Dow Jones Industrial Average Index from 1897 to 1988 to examine the linear and nonlinear predictability of stock market returns with simple technical trading rules. The nonlinear specification of returns are modeled by single layer feed forward networks. The results indicate strong evidence of nonlinear predictability in the stock market returns by using the past buys and sell signals of the moving average rules.
Does all of this mean that one is better than the other? No! Not only is it important to master TA, but you must also be aware of a company’s financial strength. Because the stock market can move in an irrational manner, charts will not accurately represent the company’s value. In addition, TA can be used because financial statements and management “misstate the truth” in some cases. Knowing how to perform both fundamental and technical due diligence is essential for both investors and traders.
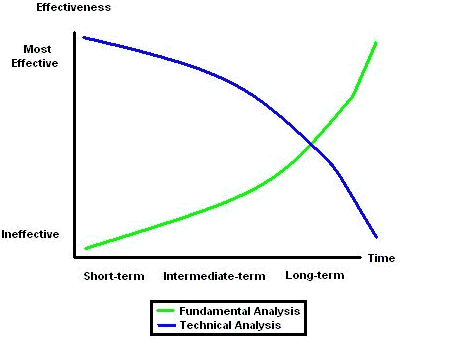
Are there times where one technique is more effective than the other? Yes! It all depends on 1) the time horizon, 2) the trader’s personality and type. Figure 13 is a chart that plots the effectiveness or ineffectiveness of both types of analyses as the time horizon shifts from short-term to long-term. In my opinion, TA is most effective in the short-term and less effective in the long-term, and fundamental analysis is most effective in the long-term and less effective in the short-term. The ability to perform both analyses gives investors and traders flexibility throughout each timeframe.
Short-term is defined as micro-trading (minutes), day trading (hours), and swing trading (days). Intermediate-term is defined as any holding period between several months up to a year and long-term is defined as 1+ years.
Figure 13. TA and FA effectiveness in long and short term trading.
Types of Technical Trading: Scalping, Day, Momentum, Swing, & Position Trading
There are five main types of trading that technical traders can utilize: scalping, day, momentum, swing, and position trading.
Scalping (or micro-trading) is all about taking very small profits, repeatedly (welcome HAL9000). Scalpers believe that stocks go in a certain direction, even for a little bit. They also believe that when trading, unfavorable events can be avoided. Even though scalping may not be suitable for the ordinary public trader, it’s important to know that scalpers provide liquidity throughout the day. Typically, trades last between seconds to minutes, so given the volume; it is not surprising that scalpers amass the most transaction fees. Scalping is an expert skill because it is easier to take a larger loss that will wipe out the entire day’s gains, so it is not recommended for beginners. The biggest benefit is if it is done correctly, the small profits will add up.
Day trading is all about buying and selling stocks on the same day and you are not holding positions overnight. Comparing day trading to scalping, this particular style calls for holding stocks for minutes to hours vs. seconds to minutes. Because of the short duration of trades, there is little room for error. Day traders even have their own set of tax rules by the IRS. The biggest benefit is that the trader liquidates their position at the end of the day.
Both scalping and day trading require strong discipline, the time and ability to learn how to rapidly trade, a tested and profitable strategy, and enough capital to withstand sudden and enormous draw downs (losses).
The next two types of trading take advantage of short-term trends and they are momentum and swing trading (see Optrader for his website on swing trading). Both are not as rapid as Scalping and Day trading, but that doesn’t make these strategies any less profitable – just ask Optrader!
In momentum trading, the trader identifies a stock that’s breaking out and jumps on to capture as much of the momentum on the way up as possible. The trader gets in at the very beginning of a trend and allows other buyers, who identify the trend, to provide the fuel to lift the stock higher. Enersis S.A. (ENI) in Figure 14 is an example of momentum trading.
Figure 14. Momentum trading of ENI.
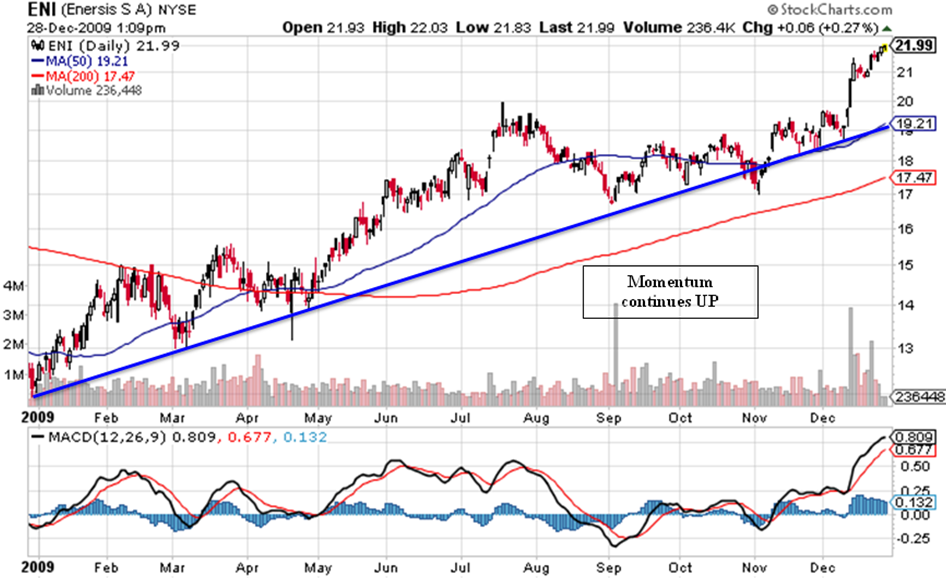
The typical time frame for momentum trading is from several hours to several days. Although momentum trading does carry overnight risk and day trading or scalping do not, there’s a possibility that there is enough force for the stock to gap up higher.
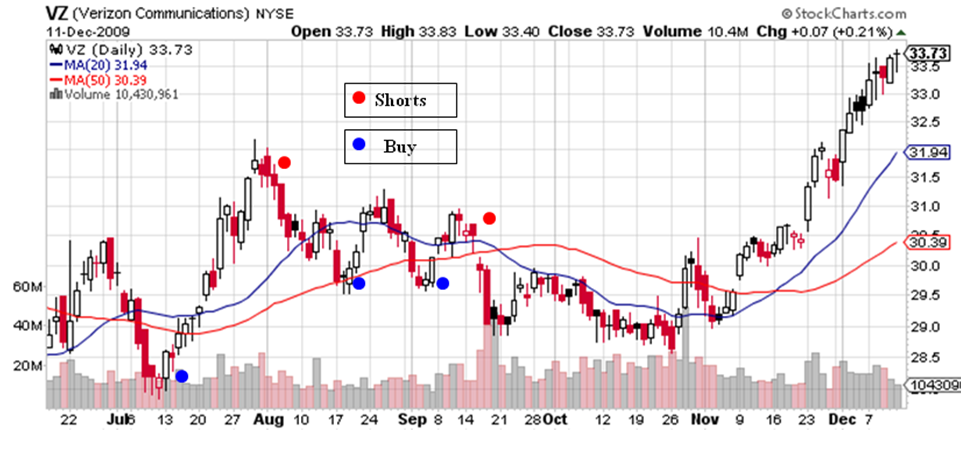
Swing Trading is the art of capturing the short-term trend. This style and position trading are the only two types of trading where a person with a full-time job can still consistently trade well part-time. Since the holding period is several days, intraday moves will not affect the swing trader as much as it would for a day trader. Typical holding periods for a swing trade is between 3-7 days. Swing trading is best used when the market or stock is in a neutral trading range, meaning the market isn’t going anywhere but up and down without much price progress. In VZ, swing trading is effective if a trader wants to take advantage of the ups and downs of this range. Notice that long-term position trading (covered next) or momentum trading will not work in this type of environment but that doesn’t mean you cannot make a profit. Use swing trading when the market or a particular stock is going nowhere. Figure 15 shows how a swing trader could follow the short term trends of Verizon (VZ).
Figure 15. Swing trading Verizon.
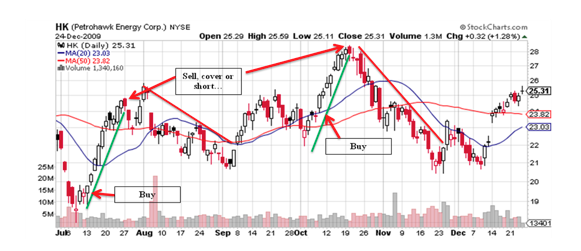
Position Traders hold stocks for weeks or months (see Figure 14 of ENI above). This style of trading is synonymous with “trend following”. The only reason to become a position trader is if you anticipate the current trend to continue for a much longer term than a momentum or swing trade. Another example of a position trade is in natural gas and oil. Petrohawk (HK) in Figure 16 has become a favorite in chat and many traders are long the stock (accumulation phase). For now, the traders are taking advantage of the stock’s wild swings, but as a position trader, they can buy on the way up and sell or cover their stock with in-the-money options when the trend changed (e.g., HK had a bearish engulfing in July which would have signaled to sell or cover). The position trader is not limited to only buying, the trader can also short (or short sell the stock). In each instance, the holding periods are for several weeks to months. Position trading gives traders a lot of freedom for those who cannot trade frequently. Profit potential is not diminished and position traders can make considerable gains. In HK’s case, over 100% going long and over 100% going short!
Figure 16. Position trader buying and selling in Petrohawk.
Now that the different strategies have been presented, the trader must decide how long the trader wants to hold a position. Here are some questions to ask:
- Am I short-term or long-term oriented?
- How much time do I have during the day to trade? Do I work full-time?
- Am I patient and able to wait, or do I need to see results quickly?
Finally, the current market environment will greatly influence what type of trading is appropriate. Mastering one style is very important, but also the trader needs to be proficient in others. If in doubt, stay in cash. Standing aside is considered a defensive position and there’s nothing wrong with waiting for an opportunity.
[2] http://www.investopedia.com/


