GDP Contraction Coming In Second Quarter 2010?
Courtesy of Mish
I have been speaking with Rick Davis at the Consumer Metrics Institute about leading economic indicators. Davis claims his data leads the GDP by about 17 weeks while noting that other so-called "leading indicators" are merely a reflection on the stock market and yield curve.
Davis captures his data solely from online transactions of real consumers, in real time.
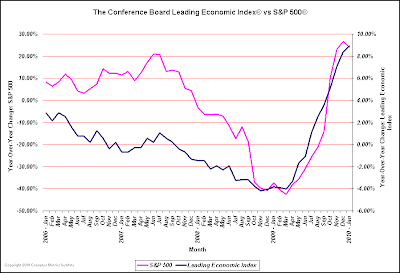
Here are a four charts. The first chart shows the Consumer Conference Board LEI, not the Consumer Metrics Index.
Consumer Conference Board LEI vs. S&P 500
Davis writes:
Is the conference board LEI really leading anything or is it merely a reflection of the stock market? A look at the actual values of the LEI and the S&P 500 over the last four years confirms the indicator is really a coincident indicator for the equity markets, published once a month, three weeks in arrears.
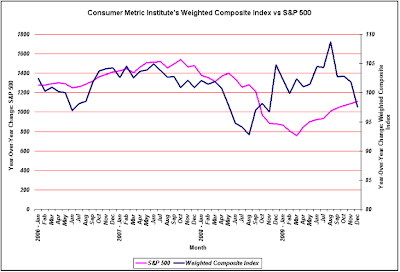
Weighted Composite Index (WCI) vs. S&P 500
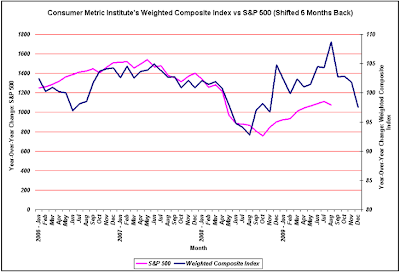
The above chart shows the Consumer Metrics Weighted Composite Index (WCI) vs. the S&P 500 Index. Watch what happens when the above data is offset by 5 months.
WCI vs. S&P 500 Shifted 5 Months
The Consumer Metrics website shows most of the WCI components advancing. However, housing and consumer spending account for roughly 60% of the index and those are contracting.
It is hard to make a case on the basis of so little data, but at least since 2006 we see evidence of actual leading.
However, the stock market does not always follow the economy nor is the stock market a leading indicator of the economy.
Please see Is the Stock Market a Leading Indicator? for a discussion.
Thus, as interesting as the above chart may be, I would not recommend using Consumer Metrics Data to project stock market movements. However, when a stock market is as lofty as this one, and a recovery is priced in that is not likely to happen, I would expect the stock market to decline if the economy tanks.
Daily Growth Index (DGI) vs. BEA GDP
The above chart shows Consumer Metrics Daily Growth Index (DGI) plotted against GDP.
According to Davis the DGI is 91-Day moving average of the WCI that corresponds to a trailing ‘quarter’, and is translated from a 100-base number into a +/- percentage. For example 99 on the WCI would roughly correspond to -1% on the DGI.
Rick Davis writes:
Hi Mish
I wanted to provide you with an update on our measurements of the consumer economy, which have continued to weaken since we spoke two weeks ago. On February 13th our "Growth Index" (which we use as a demand-side proxy or analog for a real-time "GDP" index) had dropped to an annualized contraction rate of 1.25%, down nearly a half-percent since we last spoke.
Since the most recent official GDP data from the BEA were running about 17 weeks behind our Growth Index, I assume they will continue to lag that far behind for the next two quarterly GDP updates.
If so, I have the following predictions.
Prediction 1: On April 30th the BEA will announce that the 1st Quarter 2010 U.S. GDP grew at about a 2.5% rate. This approximates our growth index’s value on November 30th, 2009 – 17 weeks prior to the 1st quarter’s end.
Prediction 2: On July 30th the BEA will announce that the 2nd Quarter 2010 U.S. GDP contracted at about a 1% rate. This is a projection of where our Growth Index will be on February 28th, 17 weeks before the end of the 2nd quarter.
Methodology Discussion
Consumer Metrics data comes solely from online transactions. As such it has many obvious biases that Davis points out in a follow-up Email.
Hello Mish
I will not disclose proprietary methods as to exactly how we capture data but I am willing to say that we are monitoring only U.S. consumers who are transacting in English on the internet. As you know, this causes some demographic sampling biases, but it has many advantages as well.
Sampling Biases
A) Our consumers may be educationally, economically and socially skewed relative to the entire U.S. population and economy.
B) We are tracking only discretionary durable goods ordered, purchased, or financed via the internet. This means that we are not capturing many significant sources of spending: groceries, non-discretionary medical services, some utilities, gasoline, non-reserved entertainment or dining, items ordered by phone or mail, bills paid by conventional check, etc.
However, in spite of some sampling biases, we have many advantages.
For example, consider the problem of inventory measurement in cyberspace vs. a few decades ago. In 1960 someone might take a clipboard and measure music industry inventory by going to the local record shop and counting Doris Day 45’s in various bins. Shipment of those 45’s may have been captured some weeks earlier in a rail car loadings report.
Today we have a different question. How do you count the inventory at the iTunes store? How many of the units sold by iTunes were captured in any rail car loadings report? Sticking with the rail car loadings for a moment: How many books sold at Amazon will be captured at any stage past pulp and dyes? How about the Kindle downloads? Are we expected to dismiss iTunes and Amazon as irrelevant to the economy?
Our long term vision is nothing short of a complete revolution in the way economic data is collected and reported. To that end we are working on a number of initiatives that expand the scope of our indicators.
We are also looking at modern real-time analogs for inventories and supply/demand pressures. Clearly eBay is a text-book model for the real-time supply/demand processes in the economy, where an abundant number of standard products can be placed in many different standard ‘shopping carts’ to monitor pricing dynamics on a daily basis.
The internet is replete with potential sources of real-time inventory data, from job postings on Monster to social inquiries on Craigslist. Mainstream economists have not started thinking about ways to capture shadow inventories or the underground economy.
Note that our Weighted Composite Index leads the S&P by about 140 days, with a standard deviation of about a quarter of that (35 days). In contrast, the conference board LEI is at best a coincident indicator.
However, the causative chain between consumer activities and subsequent equity market movements is torturous and prone to many random and perilous perturbations. Thus, historical time lags are not necessarily indications of similar future lags.
Rosenberg on the Consumer Conference Board LEI
Here is an interesting snip from Breakfast with Dave on February 19.
LEADING INDICATOR A GIANT HEADFAKE
The Conference Board’s leading economic index (LEI) rose 0.3 points in January, to 107.4 — a new high on the level. But the good news started and ended with the headline because the data beneath the surface were not so constructive. The diffusion index collapsed to 55 from 100 — the weakest breadth since March 2009. In fact, if not for the continued vital contribution from the shape of the yield curve — it only has to stay positively sloped to add to the index; it doesn’t have to move — the LEI would have actually dipped 0.1% last month.
While the LEI is making new highs, there is little reason to believe it.
Rick Davis on the LEI
Rick Davis writes:
I wonder how many people actually take the time to read theConference Board LEI Report and look at the data in it? The full report itself is a mere 9 pages.
There are several things worth noting in the report:
1) Seven of the components were actually measured and three were statistical "imputations". According to the release:
"To address the problem of lags in available data, those leading, coincident and lagging indicators that are not available at the time of publication are estimated using statistical imputation. An autoregressive model is used to estimate each unavailable component."
2) The largest positive contribution to the index in January was the yield curve, which has been providing a positive contribution continuously throughout the entire recession.
Anyone buying the LEI at face value is buying into the proposition that a favorable yield curve is sufficient to stimulate the economy.
3) The S&P 500 is among the five components showing statistically significant increases during January. Table 2 of the report, the LEI shows the S&P 500 rallied in January from 1110.38 to 1123.58.
Meanwhile, in the real world, the January price movement for the S&P 500 was actually -3.70% (1,115.10 on 12/31 to 1,073.87 on 1/29).
The S&P 500 for January was the third largest contributor to the LEI as noted in the February 18th release.
Timely, Accurate Information Not
Inquiring minds interested in the above discrepancy found a description of the lag problem in a Conference Board document written in 2002 called A More Timely and Useful Index of Leading Indicators. Here are a few pertinent paragraphs describing various problems.
"Most of the macroeconomic data for the United States require considerable time to collect, process, and release. Lags of one month are common for principal monthly indicators. For the quarterly data, including the national income and product accounts (NIPA), the lagsare longer. Moreover, many of these indicators are subject to sizable revisions that are only realized over long time intervals. The data revisions presumably reduce measurement errors but they add to uncertainty and forecasting errors, as do gaps and lags in the availability of the data."
The paper went on to point out:
"At the same time, the publication lags and revision schedules vary greatly and some indicators are everywhere available promptly. In particular, financial market price and yield data are available electronically in real time during each trading day. The U.S. leading index includes stock prices and interest rate spreads that have no significant data lags and relatively few, if any, revisions. The financial market indicators convey a great deal of information with predictive value, yet, until recently, they were represented in the leading index, not by their most recent monthly values, but by their values in the preceding month for which data for other indicators were also available."
According to the 2002 paper The Conference Board corrected that problem in 2001:
"In the old procedure, the index released during the current month (t) referred to the month (t-2). In the new procedure, implemented by The Conference Board since January 2001, the index released in the same month (t) refers to the month (t-1) … In our example, the old index would be calculated in the first week of March (t) for January (t-2), the month with a complete set of components. The new index would be calculated in the third week of March for February (t-1), the month for which 70 percent of the components are available and 30 percent are forecast."
Major LEI Problems
- Lags in Availability of Data
- Sizable Revisions
- Gaps
- Measurement Errors
- Belief the S&P 500 leads
With so many lags and gaps, even if the LEI indicators did lead, what good is it if the indicators are going be revised away later and the components are either a month old, fictional, or imputed to start?
Real World Indicators
With the consumer confidence present conditions index crashing to a low last seen in February 1983 (see Is Consumer Confidence a Contrarian Indicator? for details), there is no good reason to believe consumers will be doing a lot of heavy lifting.
Unemployed consumers typically do not spend a lot of money andWeekly Unemployment Claims Spiked To 496,000.
Couple that with the fact that New Home Sales Unexpectedly Plunge to Record Low it should not be too hard to envision a flat to negative GDP decline in the second or third quarter unless things turn around right now.
Finally, in light of the fact that economists are an amazingly optimistic these days (save a small group of notables like Dave Rosenberg, Steve Keen, and Nouriel Roubini) expect any economic surprises to be to the downside.
Throw away that V-shaped party hat. A stalled recovery or an outright economic relapse is likely just around the corner.


