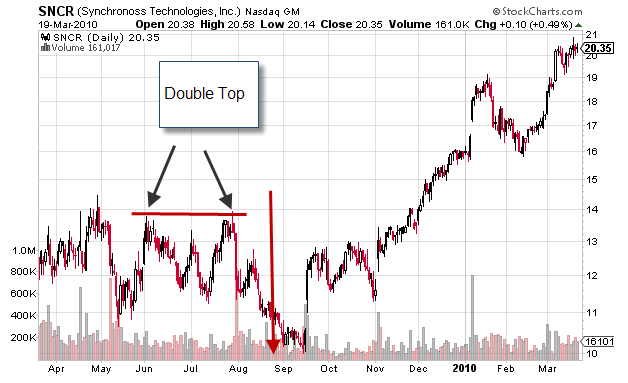
- This is a bearish reversal pattern that appears at the top of a trend and is characterized by a peak followed by a pullback and then a second peak that stalls at the level of the first peak and then retraces.
- The buyers at the top of the first peak were victims of buying from the “smart money” as they sold to the “not so smart money” at the top of the trading range.
- These unfortunate buyers will usually hold, refusing to take a loss and waiting for the opportunity to unload the stock at a breakeven.
- When that opportunity presents itself, at the second top, selling pressure increases and drives the stock lower.
- Other knowledgeable traders who know that the “Double Top” will present an opportunity to short, will do so, thereby increasing the downward move.


