Jobs Increase by 136,000; Unemployment Rate Holds at 9.7%; BLS Refused To Address My Question On Seasonality; Part-Time Work up by 738,000 in 2 Months
Courtesy of Mish
This morning the BLS reported an increase of 136,000 jobs. Headline unemployment was unchanged at 9.7%. Before diving into the numbers let’s look at a couple questions from a live Q&A session. The BLS took questions in advance.
Seasonality Question Unanswered
I asked the BLS a question regarding increasing amplitude in seasonal adjustments twice, once early in the day yesterday and once again today right at the beginning of the session. The BLS did not answer it.
The exact question I submitted is in the addendum to BLS Live Question and Answer Session on Friday, April 2nd
The BLS had plenty of time to answer or at least email me. They did neither.
From the live-chat with the BLS here are a few questions they did answer.
From Madeline: Is there an estimate for how many census workers will be hired for the current census and when those hires will occur? Are these employees full, or part-time? How does the BLS treat these employees? Are they counted as "regular" employees?
Laura Kelter (BLS-CES):
Madeline, thanks for your questions. Current information on the census intermittent worker impact on CES estimates can be found at Census 2010 temporary and intermittent workers and Federal government employment. To be considered employed in the CES survey, workers need to receive pay for any time during their pay period including the 12th of the month. Workers getting paid for just one hour would be considered employed. The CES survey cannot distinguish between full- and part-time workers.
From Bill: Hi. The headline payroll number is seasonally adjusted, and the hiring for the 2010 Census is NSA. How would you suggest adjusting for the 2010 Census hiring to determine the underlying trend (not counting the snow storms!)?
Michele Walker (BLS-CES):
Thanks for your question Bill. There is an adjustment made for the 2010 Census. Before seasonally adjusting the estimates, BLS makes a special modification so that the Census workers do not influence the calculation of the seasonal factors. Specifically, BLS subtracts the Census workers from the not-seasonally adjusted estimates before running seasonal adjustment using X-12. After the estimates have been seasonally adjusted, BLS adds the Census workers to the seasonally adjusted totals. Therefore, to determine the underlying trend of the total nonfarm (TNF) employment estimates (minus the Census workers), simply subtract the Census employment from the seasonally adjusted TNF estimate.
Click here to Replay the Q&A Session.
Census Hiring For 2010
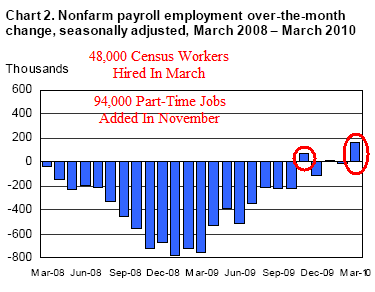
From the Census 2010 temporary and intermittent workers link we see the census added 9,000 in January, 15,000 in February, and 48,000 in March. Thus today’s headline number is more like 114,000 instead of the reported 163,000. The total for the year is 72,000.
Compared to expectations, this is a weak number.
March 2010 Report
Please consider the Bureau of Labor Statistics (BLS) March 2010 Employment Report.
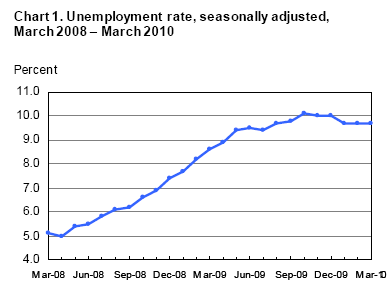
Nonfarm payroll employment increased by 162,000 in March, and the unemployment rate held at 9.7 percent, the U.S. Bureau of Labor Statistics reported today. Temporary help services and health care continued to add jobs over the month. Employment in federal government also rose, reflecting the hiring of temporary workers for Census 2010. Employment continued to decline in financial activities and in information..
Unemployment Rate – Seasonally Adjusted
Nonfarm Payroll Employment – Seasonally Adjusted
Since September 2009, temporary help services employment has risen by 313,000.
Establishment Data
click on chart for sharper image
Highlights
- 162,000 jobs were added
- 15,000 construction jobs were added
- 17,000 manufacturing jobs were added
- 82,000 service providing jobs were added
- 09,000 retail trade jobs were added
- 11,000 professional and business services jobs were added
- 45,000 education and health services jobs were added
- 22,000 leisure and hospitality jobs were added
- 39,000 government jobs were added
Professional services contributed 11,000 jobs to the plus side, but 40,000 of them were part-time jobs!
Note: some of the above categories overlap as shown in the preceding chart, so do not attempt to total them up.
Index of Aggregate Weekly Hours
Production and non-supervisory work hours were up two ticks to 33.3 hours but average hourly earnings dropped a couple of cents.
Birth Death Model Revisions 2009
click on chart for sharper image
Birth Death Model Revisions 2010
click on chart for sharper image
Birth/Death Model Revisions
The BLS Birth/Death Model methodology is so screwed and there have been so many revisions and up it is pointless to further comment other than to repeat a few general statements.
Please note that one cannot subtract or add birth death revisions to the reported totals and get a meaningful answer. One set of numbers is seasonally adjusted the other is not. In the black box the BLS combines the two coming out with a total. The Birth Death numbers influence the overall totals but the math is not as simple as it appears and the effect is nowhere near as big as it might logically appear at first glance.
The BLS added massive numbers of jobs every month to its model, all through the recession. Those jobs never existed. Last month the BLS made these revision to job totals to reflect errors in its Birth/Death model.
Birth/ Death Number for February 2010
The reported number for February was +97,000 jobs. This month the BLS assumes +81,000 jobs. I highly doubt it. Nonetheless, the BLS will stick to its model, making back revisions as necessary, until its model is in alignment with reality.
BLS Black Box
For those unfamiliar with the birth/death model, monthly jobs adjustments are made by the BLS based on economic assumptions about the birth and death of businesses (not individuals).
Birth/Death assumptions are supposedly made according to estimates of where the BLS thinks we are in the economic cycle. Theory is one thing practice is clearly another.
Household Data
In March, the number of unemployed persons was little changed at 15.0 million, and the unemployment rate remained at 9.7 percent.
The number of long-term unemployed (those jobless for 27 weeks and over) increased by 414,000 over the month to 6.5 million. In March, 44.1 percent of unemployed persons were jobless for 27 weeks or more.
The civilian labor force participation rate (64.9 percent) and the employment-population ratio (58.6 percent) continued to edge up in March.
The number of persons working part time for economic reasons (sometimes referred to as involuntary part-time workers) increased to 9.1 million in March. These individuals were working part time because their hours had been cut back or because they were unable to find a full-time job.
[Mish Note: In January the number was 8.3 million]
Persons Not in the Labor Force
About 2.3 million persons were marginally attached to the labor force in March, compared with 2.1 million a year earlier. (The data are not seasonally adjusted.) These individuals were not in the labor force, wanted and were available for work, and had looked for a job sometime in the prior 12 months. They were not counted as unemployed because they had not searched for work in the 4 weeks preceding the survey.
Among the marginally attached, there were 1.0 million discouraged workers in March, up by 309,000 from a year earlier. (The data are not seasonally adjusted.) Discouraged workers are persons not currently looking for work because they believe no jobs are available for them.
Table A-8 Part Time Status
click on chart for sharper image
The chart shows involuntary part-time employment increased by 738,000 workers in two months. Wow. A likely explanation is the BLS reported number in January is pure garbage. As I pointed out in my unanswered question, seasonal swings are increasing in amplitude.
The key take-away is there are still millions of workers whose hours will rise before companies start hiring more workers.
Table A-15
Table A-15 is where one can find a better approximation of what the unemployment rate really is.
click on chart for sharper image
Grim Statistics
The official unemployment rate is 9.7%. However, if you start counting all the people that want a job but gave up, all the people with part-time jobs that want a full-time job, all the people who dropped off the unemployment rolls because their unemployment benefits ran out, etc., you get a closer picture of what the unemployment rate is. That number is in the last row labeled U-6.
It reflects how unemployment feels to the average Joe on the street. U-6 is 16.9%.
Looking ahead, there is no driver for jobs. Moreover, states are in forced cutback mode on account of shrinking revenues and unfunded pension obligations. Shrinking government jobs and benefits at the state and local level is a much needed adjustment. Those cutbacks will weigh on employment and consumer spending for quite some time.
Expect to see structurally high unemployment for years to come.
Final Thoughts
On the plus side: Job gained across the board, the first we have seen in years.
On the negative side:
- Involuntary part-time employment increased by 738,000 workers in two months.
- The number of long-term unemployed (those jobless for 27 weeks and over) increased by 414,000 over the month to 6.5 million.
- 72,000 jobs this year are from census hiring. Those jobs will vanish by midsummer.
- There is still no driver for jobs as housing and family formation are exceptionally weak.
All things considered, this report looks OK on the surface, and horrendous underneath.
Also bear in mind that huge cuts in public sector jobs and benefits at the city, county, and state level are on the way. These are badly needed adjustments. However, the union parasites will not see it that way, nor will the politicians.


