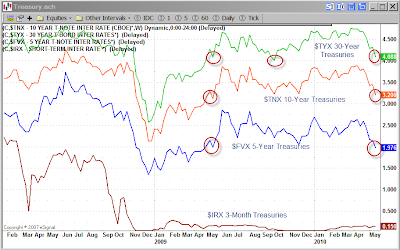
5-Year and 10-Year Treasury Yields Back at May 2009 Levels
Courtesy of Mish
Curve watchers anonymous is watching the yield curve.
Weekly Closing Chart of Treasury Yields
click on chart for sharper image
This is how today looks on Bloomberg.
Even with today’s bounce in equities, a bid remains for treasuries. This is a hint about underlying demand, and also about the so-called recovery that now seems to be gasping for air.
Note that 5 and 10-year treasury yields are at their lowest level since May of 2009. The 30-year long bond is approaching that level.
This sure isn’t hyperinflation behavior. It’s not even inflation behavior.


