What the Revised 1st Quarter GDP Numbers Really Mean
Courtesy of Rick Davis at Consumer Metrics Institute
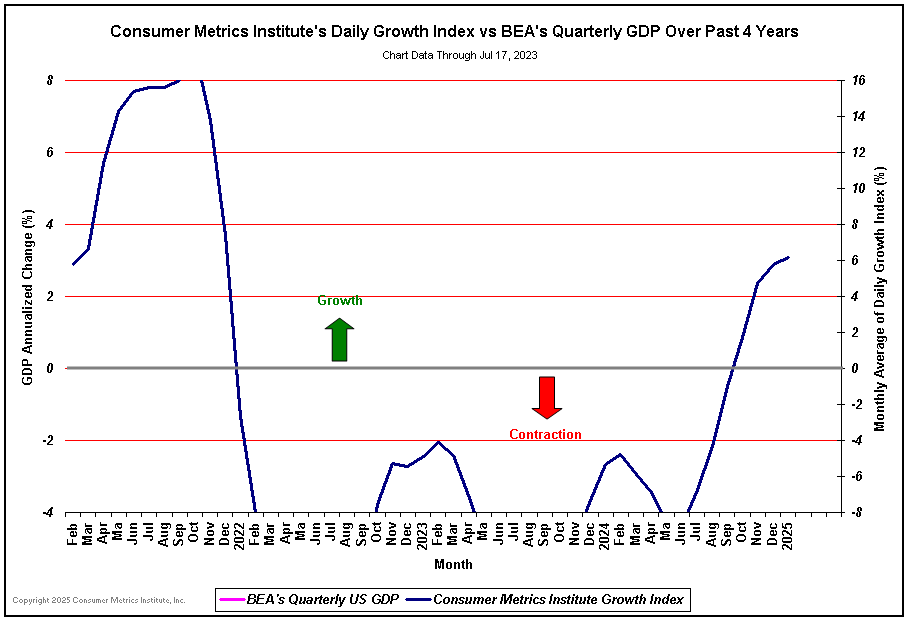
On June 25th the BEA quietly revised its measurement of GDP growth for the first quarter of 2010 down for the second time, this time to 2.7%. The newly revised growth estimate nearly matches the Consumer Metrics Institute’s original projection for the first quarter, which was 2.62%. The big difference is that the Consumer Metrics Institute’s projection (based on our Daily Growth Index) was available on November 30, 2009 — seven months ago.
Because the Consumer Metrics Institute’s Daily Growth Index only lags the real-time consumer economy by several days and has a day-by-day time resolution, the Daily Growth Index can also tell us something totally missing in the BEA report: that the newly revised GDP ‘freeze frame’ picture captures a moment in time when consumer demand was dropping at a rate of about .08% per day. This means that the difference between the revised GDP and our original projection represents only a single day of economic change. But more importantly, our Daily Growth Index shows the dynamics of the economy at the point in time when the BEA ‘still picture’ was taken.
One other important note should be made about the June 25th BEA release: in it the BEA also increased the inventory component within the 2.7% number from 1.65% to 1.88%. That means that the net-after-inventory-adjustments number was less than 0.9%, and over two-thirds of the reported aggregate growth was from relatively unpredictable inventory swings.
If factories were unwittingly growing inventories during the first quarter in the face of what was really slackening consumer demand, the official GDP numbers for both the second quarter and the third quarter (to be released 4 days before the U.S. mid-term elections) could be interesting, since factories could very well over-correct again — but in the opposite direction.
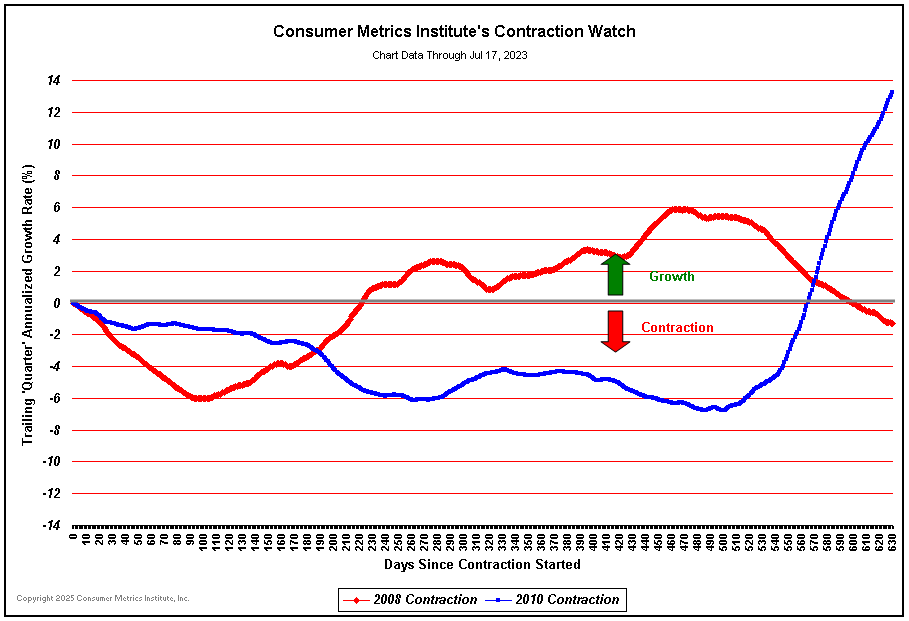
Because Friday’s BEA release mirrors our Daily Growth Index from November 30th, the index’s subsequent course provides some insight into where the economy has been heading since then. Roughly half a quarter later (on January 15th, 2010) the index fell into net year-over-year contraction. During the nearly two quarters since then the index has been showing mild but continued contraction. When that contraction is charted along with similar contraction ‘events’ from 2006 and 2008 it can be seen that 2010 is shaping up as wholly unique:
As the chart shows, the current contraction has progressed for nearly two quarters without yet tracing a clearly formed bottom. And any measure of the severity of an economic slowdown must include not only maximum rate of contraction, but duration as well. Although the 2010 event has been milder than 2008 in terms of absolute negative growth rates observed, if it progresses long enough the aggregate economic pain could be substantial. For a little perspective, the total economic impact of 2010’s contraction is already nearly twice what was experienced in 2006, when the GDP slipped to a barely positive +0.1% growth rate. And (to date) the total economic impact of the 2010 event represents nearly a full third of the pain experienced during the ‘Great Recession’ of 2008-2009.
The key message to take from these numbers is that the fundamental change in consumer behavior which we have been observing over the past three quarters is likely to be protracted. Although this change in behavior is most clearly shown in our data by consumer reluctance to take on new or increased debt, it probably reflects de-leveraging much more than balance sheets — almost certainly including de-leveraged consumer expectations for the near future.
At the Consumer Metrics Institute we measure day-by-day changes in the discretionary durable goods transactions of internet shopping consumers. We genuinely believe that the real economy lives where ‘Main Street’ consumers are (figuratively and/or literally) clicking ‘Add to Shopping Cart’, not where the BEA’s factories slavishly follow the consumer’s lead. The millions of consumers we measure respond collectively to what they see going on with their own local economy, family and friends. And right now real-world ‘Main Street’ consumers are demonstrating significant caution.
Thank you,
Rick Davis
Consumer Metrics Institute


