DARK HORSE HEDGE 7-18-10
By Scott at Sabrient and Ilene of PSW
Friday gave us a real-time example of why we use Hysteresis* and confirmations from our technical signals, MACD 12-26-9 and RSI 14-day, to select and monitor the tilt (long-short ratio) of the Dark Horse Hedge’s portfolio.
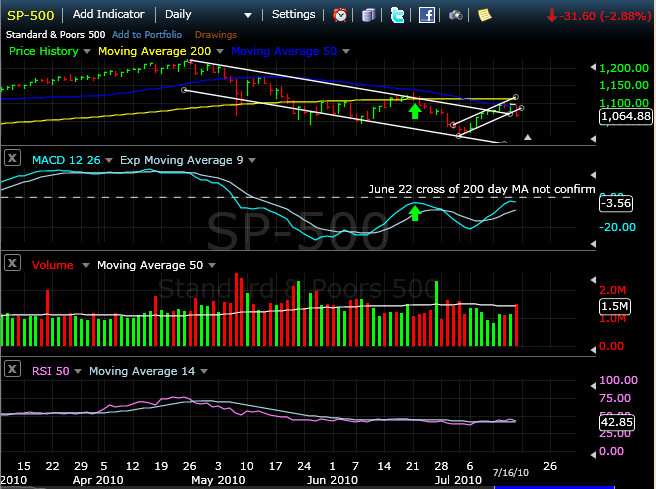
The SHORT tilt Friday allowed us to make +1.37% from our 6 SHORT, 3 LONG positions while the S&P 500 gave back -2.88%. The economic data out Friday of course played a large roll in the failure of our indicators to turn from short to BALANCED. A sharp decline in the University of Michigan Consumer Index to 65 in July compared poorly with a June figure of 76 and Briefing.com’s estimate of 74.5. Google’s earnings miss didn’t help either as the S&P 500 fell through its short-term support area to close at 1064.88. The MACD reading is currently at -3.56 and RSI 14-day at 42.85 (bullish signal is above 50). The preponderance of evidence heading into the July 19 week is that the market needs to find support in the 1040 range.
Despite the poor economic data that pushed the market lower on Friday, 19 of 23 S&P 500 companies reporting thus far reported better than projected EPS, and 15 of them beat revenues as well.
Earnings reports will continue to flow in this week. In our portfolio Western Digital Corp (WDC, long position) reports profits on Tuesday while USG Corp (USG, short position) and Sun Trust Banks Inc (STI, short position) report their losses on July 22. We will continue to monitor the market action and look for guidance on entering new positions. Key support areas appear to be 1040, 1022 and then 995.
Dark Horse Hedge maintains 10% cash for swing trade opportunities and we are highlighting one for entry on Monday at the Open.
SHORT Terex Corp. (TEX) at the Open Monday.
TEX will report its latest loss figures on Tuesday, July 21. Twenty analysts project losses ranging from -$.15 to -$.44 with an average of -$.30. Looking back over the last four quarterly announcements, we see analysts often underestimate Terex’s losses. For example, in March 2010, analysts estimated -$.52 while the actual loss was $.64. In December 2009, analysts targeted -$.49 and TEX delivered -$.89. In September 2009, the loss was projected to be $.34 and the company came in at -$.77. In June 2009, investors were looking at an estimate of -$.28 and received a greater loss of $.38. Nothing leads us to believe the July 21 report will be anything different and so we are recommending a SHORT position at Monday’s open with the intention of closing it shortly after the loss is reported. TEX has a strong sell rating using Sabrient’s ranking system, with low scores for value, growth and momentum. (The momentum measure reflects more fundamental measures, rather than technical measures.)
|
Ratings Report
|
||||||
|---|---|---|---|---|---|---|
|
SABRIENT SCORES
|
||||||
| TEX | STRONGSELL | 18.2 | Mid-Cap | 26 | 45 | 43 |
S&P 500 CHART
chart created at freestockcharts.com
*Hysteresis
In determining when a shift in "tilt" is appropriate, we apply a "hysteretic" model. Hysteresis refers to systems that have memory, where the effects of the current input (or stimulus) to the system are experienced with a certain memory for the previous input and a certain delay in reaction time. Hysteresis is defined as "the phenomenon exhibited by a system in which the reaction of the system to changes is dependent upon its past reactions to change" and as "the lag in response exhibited by a body in reacting to changes in the forces." Using a hysteretic formula, we look for more confirmation of a breakout than just breaking across a Moving Average on a given day.
Quantitative analysis involves a graduate level economics course to thoroughly explain, but that isn’t necessary for our purposes. The important thing to understand is that we take into consideration the direction of the movement across a Moving Average, and the support from other indicators such as MACD and RSI, to accumulate a preponderance of evidence prior to changing our overall tilt. To avoid whipsaw movements as the indexes trade along their 50-day and/or 200-day Moving Averages, we employ a hysteretic formula to delay altering the tilt until the movement is confirmed by multiple variables or until prices remain above the Moving Averages for several days.
DARK HORSE HEDGE’s portfolio and new short for 7/19/2010
By Scott at Sabrient and Ilene of PSW
SHORT Terex Corp. (TEX) at the Open Monday 7/19.
Previously initiated positions (click on the ticker for Sabrient’s report).
Longs (opening prices):
Western Digital Corp., WDC long at $31.90 on July 13
Xyratex Ltd, XRTX, long at $14.64 on July 1
Telecom Argentina S.A., TEO, long at $16.38 on July 1
Shorts (opening prices):
Apartment Investment and Management Co., AIV, short at $20.73 on July 13
Sun Trust Bank, STI, short at $25.54 on July 13
The St. Joe Company, JOE, short at $23.74 on July 1
USG Corporation, USG, short at $12.08 on July 1
Houston American Energy Corp, HUSA, short at $9.91 on July 1
AMAG Pharmaceuticals, Inc., AMAG, short at $34. 38 on July 1
*****
Follow the DHH’s market thoughts and new buys and sells here.
Stock selection by Scott using Sabrient‘s analytical tools. Read more about Sabrient’s newsletters here.>
Authors have no positions in the above-mentioned stocks.


